Download
1 / 5

E N D
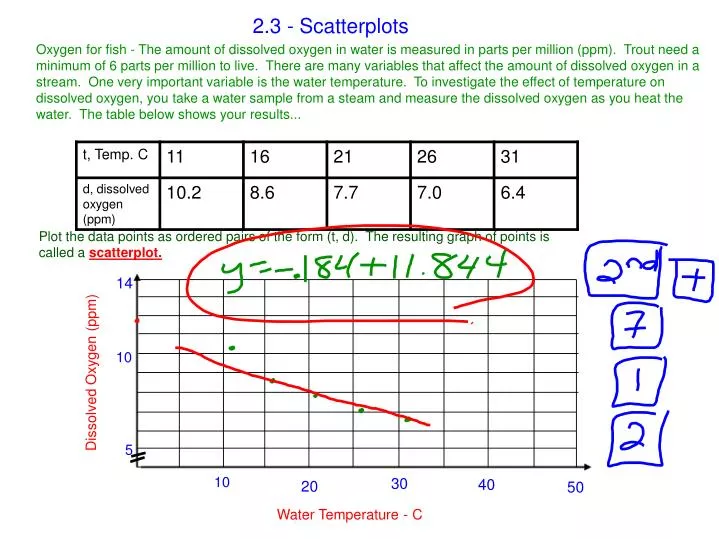
2.3 - Scatterplots Oxygen for fish - The amount of dissolved oxygen in water is measured in parts per million (ppm). Trout need a minimum of 6 parts per million to live. There are many variables that affect the amount of dissolved oxygen in a stream. One very important variable is the water temperature. To investigate the effect of temperature on dissolved oxygen, you take a water sample from a steam and measure the dissolved oxygen as you heat the water. The table below shows your results... Plot the data points as ordered pairs of the form (t, d). The resulting graph of points is called a scatterplot. 14 10 Dissolved Oxygen (ppm) 5 10 30 40 20 50 Water Temperature - C
1. Does there appear to be a linear relationship between the temperature, t, and the amount of dissolved oxygen, d? Is there an exact linear fit? That is, do all the points lie on the same line? 2. Now draw a single line through the points (0, 12) and (11, 10). This line can be used to represent the linear trend in the data. Such a line is commonly called a line of best fit. 3. Determine the slope of the line using the points (0, 12) and (11, 10). 4. What is the d-intercept of this line? The d-intercept is the d-value of the point where the line intersects the d-axis. 5. What is the equation of the line? Use the linear model d=mt + b, where m is the slope of the line and b is te d-intercept. 6. Approximate the maximum temperature at which trout can survive. Recall that trout need a minimum of 6 ppm of dissolved oxygen to live.
Goodness-of-fit measure An estimate of how well a linear model represents a given set of data is called a goodness-of-fit measure. Steps for determining the goodness-of-fit measure Step 1: Use the equation we derived in problem 5 to complete the table: Step 2: Determine the sum of the absolute values of the differences in the last colum. This sum is called the error or goodness-of-fit measure. The smaller the error, the better the fit.