Download
1 / 1
10 likes | 115 Views
Recent Climate Change in Iowa and Farmer Adaptation Shannon L. Rabideau, Eugene S. Takle Department of Geological and Atmospheric Sciences, Iowa State University. Introduction

E N D
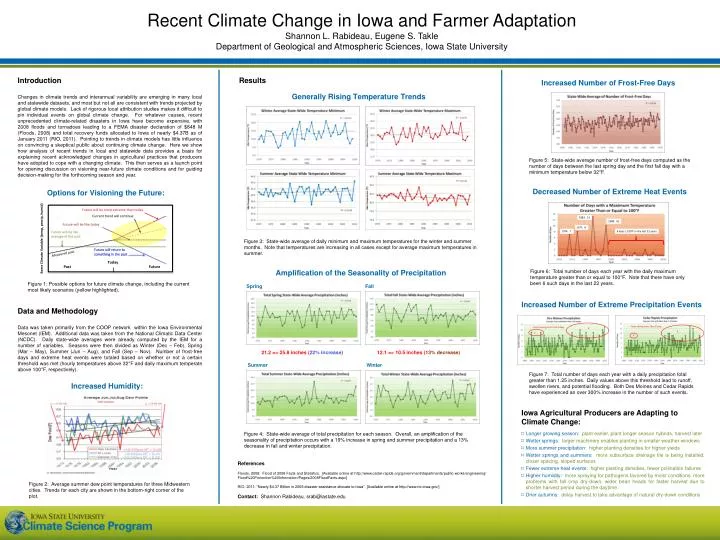
Recent Climate Change in Iowa and Farmer Adaptation Shannon L. Rabideau, Eugene S. Takle Department of Geological and Atmospheric Sciences, Iowa State University Introduction Changes in climate trends and interannual variability are emerging in many local and statewide datasets, and most but not all are consistent with trends projected by global climate models. Lack of rigorous local attribution studies makes it difficult to pin individual events on global climate change. For whatever causes, recent unprecedented climate-related disasters in Iowa have become expensive, with 2008 floods and tornadoes leading to a FEMA disaster declaration of $848 M (Floods, 2008) and total recovery funds allocated to Iowa of nearly $4.37B as of January 2011 (RIO, 2011). Pointing to trends in climate models has little influence on convincing a skeptical public about continuing climate change. Here we show how analysis of recent trends in local and statewide data provides a basis for explaining recent acknowledged changes in agricultural practices that producers have adopted to cope with a changing climate. This then serves as a launch point for opening discussion on visioning near-future climate conditions and for guiding decision-making for the forthcoming season and year. Results Increased Number of Frost-Free Days Generally Rising Temperature Trends Figure 5: State-wide average number of frost-free days computed as the number of days between the last spring day and the first fall day with a minimum temperature below 32°F. Decreased Number of Extreme Heat Events Options for Visioning the Future: Future will be more extreme than today Current trend will continue 1983: 13 1988: 10 Future will be like today 1977: 8 1974: 7 6 days ≥ 100oF in the last 22 years Future will be like average of the past Some Climate Variable (temp, precip, humid) Figure 3: State-wide average of daily minimum and maximum temperatures for the winter and summer months. Note that temperatures are increasing in all cases except for average maximum temperatures in summer. Future will return to something in the past Measured past Today Past Future Amplification of the Seasonality of Precipitation Figure 6: Total number of days each year with the daily maximum temperature greater than or equal to 100°F. Note that there have only been 6 such days in the last 22 years. Figure 1: Possible options for future climate change, including the current most likely scenarios (yellow highlighted). Spring Fall Increased Number of Extreme Precipitation Events Data and Methodology Data was taken primarily from the COOP network within the Iowa Environmental Mesonet (IEM). Additional data was taken from the National Climatic Data Center (NCDC). Daily state-wide averages were already computed by the IEM for a number of variables. Seasons were then divided as Winter (Dec – Feb), Spring (Mar – May), Summer (Jun – Aug), and Fall (Sep – Nov). Number of frost-free days and extreme heat events were totaled based on whether or not a certain threshold was met (hourly temperatures above 32°F and daily maximum temperate above 100°F, respectively). Years having more than 8 days Years having more than 8 days 8 9 2 0 21.2 => 25.8 inches (22% increase) 12.1 => 10.5 inches (13% decrease) Summer Winter Figure 7: Total number of days each year with a daily precipitation total greater than 1.25 inches. Daily values above this threshold lead to runoff, swollen rivers, and potential flooding. Both Des Moines and Cedar Rapids have experienced an over 300% increase in the number of such events. Increased Humidity: Iowa Agricultural Producers are Adapting to Climate Change: • Longer growing season: plant earlier, plant longer season hybrids, harvest later • Wetter springs: larger machinery enables planting in smaller weather windows • More summer precipitation: higher planting densities for higher yields • Wetter springs and summers: more subsurface drainage tile is being installed, closer spacing, sloped surfaces • Fewer extreme heat events: higher planting densities, fewer pollination failures • Higher humidity:more spraying for pathogens favored by moist conditions. more problems with fall crop dry-down, wider bean heads for faster harvest due to shorter harvest period during the daytime. • Drier autumns:delay harvest to take advantage of natural dry-down conditions Figure 4: State-wide average of total precipitation for each season. Overall, an amplification of the seasonality of precipitation occurs with a 19% increase in spring and summer precipitation and a 13% decrease in fall and winter precipitation. References Floods, 2008: Flood of 2008 Facts and Statistics. [Available online at http://www.cedar-rapids.org/government/departments/public-works/engineering/ Flood%20Protection%20Information/Pages/2008FloodFacts.aspx] RIO, 2011: “Nearly $4.37 Billion in 2008 disaster assistance allocate to Iowa”. [Available online at http://www.rio.iowa.gov/] Contact: Shannon Rabideau, srab@iastate.edu Figure 2: Average summer dew point temperatures for three Midwestern cities. Trends for each city are shown in the bottom-right corner of the plot.