Download
1 / 31
310 likes | 430 Views
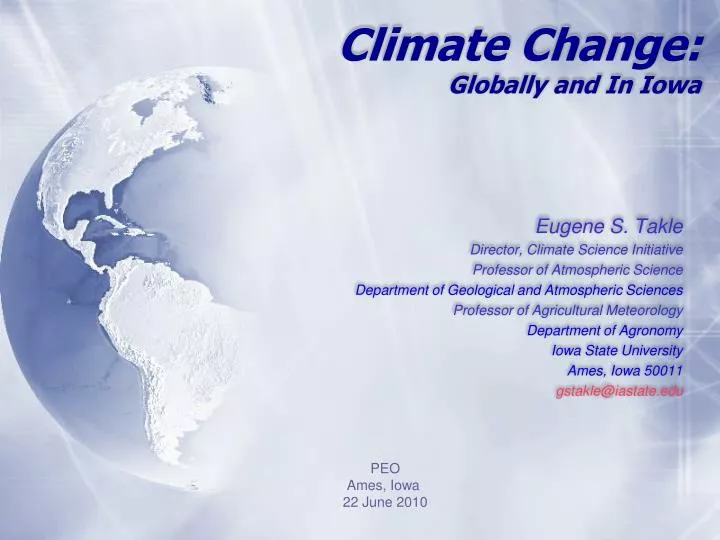
Climate Change: Globally and In Iowa. Eugene S. Takle Director, Climate Science Initiative Professor of Atmospheric Science Department of Geological and Atmospheric Sciences Professor of Agricultural Meteorology Department of Agronomy Iowa State University Ames, Iowa 50011

E N D
Climate Change:Globally and In Iowa Eugene S. Takle Director, Climate Science Initiative Professor of Atmospheric Science Department of Geological and Atmospheric Sciences Professor of Agricultural Meteorology Department of Agronomy Iowa State University Ames, Iowa 50011 gstakle@iastate.edu PEO Ames, Iowa 22 June 2010
Observations: global mean temperature and carbon dioxide are rising together since 1860 Base period 1961-90
Global average sea level is rising from expansion of water due to warming and melting glaciers Since 1992 sea level has risen 55mm (2.2 inches) www.aviso.oceanobs.com/en/news/ocean-indicators/mean-sea-level/
Models: Natural processes do not account for observed 20th century warming after 1965
State-Wide Average Data 37.5” 31.5” 19% increase
State-Wide Average Data Totals above 40” 8 years 2 years
Cedar Rapids Data 28.0” 32% increase 37.0”
Cedar Rapids Data 51% increase 11.8” 7.8”
Cedar Rapids Data 34% increase 20.2” 26.8”
“One of the clearest trends in the United States observational record is an increasing frequency and intensity of heavy precipitation events… Over the last century there was a 50% increase in the frequency of days with precipitation over 101.6 mm (four inches) in the upper midwestern U.S.; this trend is statistically significant “ Karl, T. R., J. M. Melillo, and T. C. Peterson, (eds.), 2009: Global Climate Change Impacts in the United States. Cambridge University Press, 2009, 196pp.
Cedar Rapids Data 57% increase 6.6 days 4.2 days
Cedar Rapids Data Years having more than 8 days 11 2 57% increase 6.6 days 4.2 days
Great Flood of 1993 in the US Midwest: A New “Great Lake” Historical Data indicate this should happen about once every 500 years Lakshmi, V., and K. Schaaf, 2001: Analysis of the 1993 Midwestern flood using satellite and ground data. IEEE Trans. Geosci & Remote Sens., 39, 1736-1743.
“The future isn’t what it used to be” Yogi Berra
Global Carbon Emissions (Gt) Actual emissions are exceeding worst case scenarios projected in 1990
Source: Jerry Meehl, National Center for Atmospheric Research
Energy intensive Balanced fuel sources More environmentally friendly Limit to avoid “dangerous anthropogenic Interference” with the climate system 2oC limit IPCC Fourth Assessment Report Summary for Policy Makers
Karl, T. R., J. M. Melillo, and T. C. Peterson, (eds.), 2009: Global Climate Change Impacts in the United States. Cambridge University Press, 2009, 196pp.
Karl, T. R., J. M. Melillo, and T. C. Peterson, (eds.), 2009: Global Climate Change Impacts in the United States. Cambridge University Press, 2009, 196pp.
Low confidence Karl, T. R., J. M. Melillo, and T. C. Peterson, (eds.), 2009: Global Climate Change Impacts in the United States. Cambridge University Press, 2009, 196pp.
Trend of increase in occurrence of heavy precipitation over the 20th C is consistent with increasing GHG concentrations. Frequency of intense precipitation events is likely to increase in the future. Karl, T. R., J. M. Melillo, and T. C. Peterson, (eds.), 2009: Global Climate Change Impacts in the United States. Cambridge University Press, 2009, 196pp.
Relationship of Streamflow to Precipitation in Current and Future Climates
SWAT (RegCM2): 21 % increase in precip -> 50% increase in streamflow Relationship of Streamflow to Precipitation in Current and Future Climates DrainMod (RegCM2): 24 % increase in precip -> 35% increase in tile drainage DrainMod (HIRHAM): 32 % increase in precip -> 80% increase in tile drainage
Iowa Agricultural Producers’ Adaptations to Climate Change • Longer growing season: plant earlier, plant longer season hybrids, harvest later • Wetter springs: larger machinery enables planting in smaller weather windows • More summer precipitation: higher planting densities for higher yields • Wetter springs and summers: more subsurface drainage tile is being installed, closer spacing, sloped surfaces • Fewer extreme heat events: higher planting densities, fewer pollination failures • Higher humidity: more spraying for pathogens favored by moist conditions. more problems with fall crop dry-down, wider bean heads for faster harvest due to shorter harvest period during the daytime. • Drier autumns: delay harvest to take advantage of natural dry-down conditions Is it genetics or climate? Likely some of each. HIGHER YIELDS!!
For More Information • North American Regional Climate Change Assessment Program: http://www.narccap.ucar.edu/ • For current activities on the ISU campus, regionally and nationally relating to climate change see the Climate Science Initiative website: http://climate.agron.iastate.edu/ • Contact me directly: gstakle@iastate.edu