Download
1 / 39
390 likes | 498 Views
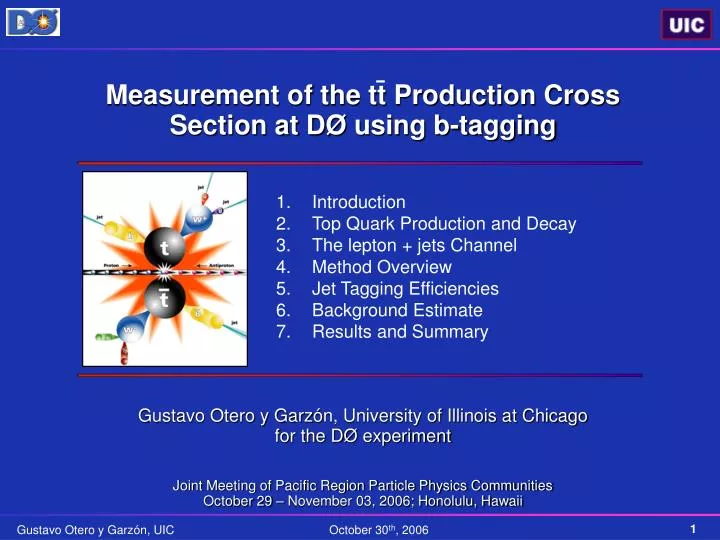
Measurement of the tt Production Cross Section at D Ø using b-tagging. Introduction Top Quark Production and Decay The lepton + jets Channel Method Overview Jet Tagging Efficiencies Background Estimate Results and Summary. Gustavo Otero y Garz ó n, University of Illinois at Chicago

E N D
Measurement of the tt Production Cross Section at DØ using b-tagging Introduction Top Quark Production and Decay The lepton + jets Channel Method Overview Jet Tagging Efficiencies Background Estimate Results and Summary Gustavo Otero y Garzón, University of Illinois at Chicago for the DØ experiment Joint Meeting of Pacific Region Particle Physics Communities October 29 – November 03, 2006; Honolulu, Hawaii
stt ! • The top quark was discovered 11 years ago and so far it has been only observed at Fermilab • RunI measured sttbar to a 25% precision with L~100pb-1 and s=1.8 TeV • At present, 30% higher production rate at s=1.96 TeV and higher luminosity • The theoretical prediction of sttbar has a 9-12% accuracy • Top pair events are an important background source for other physics processes • Single Top • Higgs search • Measuring the top pair production cross section is the first step toward any Top property analysis
15% 85% • Final state determined by the decay of the W boson • dilepton channel (low bkg) • lepton + jets channel (moderate bkg) • all hadronic channel (huge bkg) Lepton≡ e, m from W or from t from W Top Quark Pair Production and Decay • Top quarks are mainly produced in pairs (strong interactions) at Tevatron energies • sinel / sttbar~ 1010 • High luminosity • High efficiency • No hadronic bound state due to short lifetime • Electroweak decay |Vtb|~1
The Lepton + Jets Channel Background signal W ( l ) + ≥ 3jets QCD Multijet • fake isolated lepton • misreconstructed MET • 1 isolated high pT lepton (µ, e) • 1 n(reconstructed as missing transverse energy (MET)) • ≥ 3 high pT central jets
ttbar physics bkg QCD loose preselection tight preselection Events with ≥1 b-jet (tt has 2 b-jets!) Extract stt from the excess over the predicted background b-tagging Method Overview QCD Multijet events dominate in pp collisions • Select a leptonically decaying W boson in association with jets • Select objects in the final state with high efficiency and purity minimizing the instrumental background (QCD and W-like events determined from data)
b-tagging • b-quarks hadronize into long lived (ct ~ 450mm) B hadrons which travel a few millimeters before decaying • b-jets can be identified! • Soft Lepton Tagging: lepton within a jet from a semileptonic B decay • Secondary Vertex Tagging: reconstruct SV from tracks significantly displaced from the PV originating from lifetime effects of B hadrons • To decouple tagging efficiency from tracking inefficiencies and calorimeter noise problems the SVT tagging probability is split into: • Probability for a jet to be taggable • Probability for a jet to be tagged
Taggability • A jet is taggable if it has a matched track-jet • Tracks in a track-jet must have hits in the SMT • Strong dependence on the SMT geometry • Parameterized vs. hjetandpT jet in 6 bins of sign(PVZ * hjet)*|PVZ| • Measured in l+jets data • Taggability is jet flavor dependent • Corrected with ratios of b(c) / light taggabilities measured in MC
Inclusive b (c) tagging rates measured in tt MC and corrected with SFdata-MC b-Tagging Efficiency • Semileptonic b-tagging rate measured purely from 2 m-in-jet data samples (subset enriched in heavy flavor) • Parameterized in terms of pTjet and hjet • Calibrated by data-to-MC scale factor given by the ratio of semileptonic b-tagging efficiencies measured in data and bb MC
Mistag Rate • A light (u,d,s,g) jet identified as heavy flavor is a mistag (fake tag) • Originated from misreconstruction and resolution effects • Determined from the negative tagging rate • Measured in QCD data, dominated by light jets (e-data) • MC based corrections to e-data for: • Heavy flavor contamination in QCD data (~0.5) • Long lived particles (K0S, L0) not present in e- (~1.6)
P ≥ 2 tagtt 4 ≥ jets = 0.14 P= 1 tagtt 4 ≥ jets = 0.45 Event Tagging Probability Jet Taggabilityflavor a Per Jet Probability Event Tagging Probability Jet Tagging Probabililtyflavor a (Weight all jets) Trigger weight a = b, c, light • W+jets tagging probabilities: • Add probabilities for different flavor configurations • Weight each configuration with the corresponding flavor fraction • Fractions determined as cross section ratios of hadron-matched-jets ALPGEN MC samples
Npreseli = stheoryixepreselix BR xL i = single top, diboson and Ztt Background Estimate • QCD-multijet production in the tagged sample: • Apply the Matrix Method to the tagged data sample • Additional low rate electroweak background processes Ntagbkg i = Npreseli x Ptagi • W+jets (dominant background) • Overall normalization from data • Apply different tagging probabilities based on the flavor configurations NPresel W+jets = Nsig - NPreseltt - ∑Npresel i
Single tags Double tags Cross Section Extraction • The ttbar cross-section is calculated combining 8 channels • e + jets and m+ jets • single tags and double tags • = 3 jets and 4 jets Systematic Uncertainties
The Soft Lepton Tag Analysis • SLT tagging depends on the physics process • Tagging rates measured in MC for each process (in agreement with tagging rates measured in data!) • Same philosophy as the SVT analysis • Same preselected data set • Same backgrounds + Z → m+m-(determined from MC, normalized to data) • Similar cross section extraction procedure (single and double together)
sttbar = 7.3 +2.0-1.8(stat+syst) ± 0.4(lum) pb sttbar = 6.6 ± 0.9(stat+syst) ± 0.4(lum) pb l + jets : l + jets : Based on 425 pb-1 of DØ data sttbarNLO = 6.8 ± 0.6 pb N. Kidonakis and R. Vogt, Phys. Rev. D 68 (2003) Results Perform a maximum likelihood fit to the observed number of events incorporating all systematic uncertainties in the fit using a nuisance parameter likelihood method SVT SLT SVT
Summary • Entering the top quark precision measurement era at the Tevatron • Results in agreement with the Standard Model prediction at NLO • First preliminary DØ RunII result with SLT • SVT analysis currently DØ’s most precise top cross section measurement (down to 15% uncertainty) • Better understanding of systematic uncertainties (12% stat 8% syst) • At the DØ gate on its way to PRD (FERMILAB-PUB-06-386-E) … expect fb-1 results soon!
425pb-1 The Tevatron and DØ • Tevatron • Proton anti-proton collider • s = 1.96 TeV • ~1.8 fb-1 delivered • Expected x40-80 Run I data set! • DØ • A truly international collaboration • Multipurpose detector • central tracking embedded in a solenoidal field • preshowers • EM and hadronic calorimeters • muon system
Why study the Top Quark? • Predicted in the’70s by the SM and discovered in 1995 • Least well studied component of the SM (only produced at the Tevatron so far) • Only known fermion with a mass at the natural Electroweak scale • Lifetime (5x10-25 s) shorter than the hadronization time (no top hadronic bound states) • The top quark is relevant for many Electroweak analyses • Strongest coupling to the Higgs (Yukawa coupling lt mt~ 1)
The Top Quark and the SM Higgs Corrections to W and Z boson masses from top quark and Higgs boson loops constrain the Higgs boson mass MW2 = MW(0) x(1- D) Dt-1 ~ Mt2 Goal for Tevatron in Run II: DMt = 3 GeV DMW = 20 MeV DH ~ ln ( MH2 )
Top Quark Physics W Helicity Production Cross Section Production Kinematics Top Spin Polarization Resonance Production Top Charge Branching Ratios |Vtb| Spin Correlation Non-SM decays Top Mass
LHC Tevatron Top Quark Pair Production Top quarks are mainly produced in pairs (through strong interactions) at Tevatron energies (electroweak production to be observed soon!) • sinel / sttbar~ 1010 • High luminosity • High efficiency
Top Quark Decay • tSM 1.5 GeV (mt=175 GeV) ~10-25 s no hadronic bound states • Top quark decays via the Weak interaction exclusively as t W b • |Vtb|>0.999 • R = 1.03 ± 0.19 (hep-ex/0503002) • Negligible rates for FCNC (t q ,Z,g) • Final state determined by the decay of the W boson: • dilepton channel (low bkg) • lepton + jets channel (moderate bkg) • all hadronic channel (huge bkg) Lepton≡ e, m from W or t from W
esig efficiency for a loose lepton from a W decay to pass the tight criteria ~85% Nl = Nsig + NQCD eQCD rate for a loose lepton in QCD to appear to be tight ~15% esig eQCD Nt = esig.Nsig + eQCD.NQCD Preselected Sample • Require: • All events pass the signal trigger • A tight isolated lepton • Large MET (neutrino) • At least one jet • MET separated from the lepton in the transverse plane • Second lepton veto (orthogonal to dilepton analyses) • Composition of the preselected sample determined by defining two samples (Matrix Method) • Tight sample : the preselected sample ( Nt) • Loose sample : events passing the preselection but with a loose lepton requirement • Top events populate 3rd and 4th jet multiplicity bins • Events with 1 and 2 jets used as control of background estimate
Event Simulation • ttbar and W+jets are generated using ALPGEN 1.3 followed by PYTHIA 6.2 to simulate the underlying event and the hadronization • Other small backgrounds • Single top (CompHEP/PYTHIA) • Diboson (ALPGEN/PYTHIA) + NLO K-factor • Z/gamma* (PYHIA) @ NNLO • TAUOLA simulates t decays • W+jets samples are generated separately for processes with 1,2,3, and 4 or more partons in the final state using ALPGEN
W+jets event generation • LO parton level calculations from ALPGEN need to be combined with the partonic evolution from PYTHIA to avoid double counting of configurations leading to the same final state • Ad-hoc MLM matching is used: matrix element partons are matched to reconstructed jets within a 0.5 cone and classified according to the number of HF jets in the final state • Keep events only if the number of reconstructed jets equals the number of matrix element partons in the 1,2,3 jets bin. • Keep all events with >=4 reconstructed jets in the n>=4 jets bin, independently of the additional number of non-matched light jets. • NLO K-factor applied to the Wbbar, Wccbar, W(bbbar) and W(ccbar) Systematic error on the fractions comes from difference between matching schemes, choice of matching cone size, PDF and renormalization and factorization scales
Jet Flavor Identification in MC • For all MC samples, the jet flavor (b, c, or light) is determined by matching the direction of the reconstructed jet to the hadron flavor within a cone of R=0.5 • If more than one hadron is found within the cone, the jet is considered a: • b-jet, if the cone contains at least one B hadron • c-jet, if the cone contains at least one C, and no B hadron • light, if the cone contains no B or C hadron.
W+jets Background • The dominant background by far • Overall normalization before tagging obtained directly from Data • Number of W+jets events in the tagged sample determined by • The event tagging probability results from adding the tagging probabilities for the different flavor configurations weighted with their fractions
Use of tracks with significant impact parameter with respect to the Primary Vertex Secondary Vertex Tagger Algorithm The Secondary Vertex Tagger (SVT) is a lifetime tagger that explicitly reconstructs vertices which are displaced from the Primary Vertex • Build-up method fitting pairs of selected tracks within track-jets • Removes track pairs in the mass windows corresponding to K0S, L0 and photon conversions (g→ e+e-) • A jet is identified as a b-jet (tagged) if it contains a reconstructed secondary vertex within a jet Top events have two b-jets while events from other processes very seldom have heavy flavor!
Data set used Data Sample • Run Quality, Luminosity Block and Event Quality Selections applied • A lepton and a jet are required at trigger level • Trigger efficiencies are estimated by folding into the MC the per-object individual trigger conditions measured in Data
Analysis Method • Determine the number of selected events for each background • Parameterize the tagging efficiencies determined in data • Determine event tagging probabilities for all the backgrounds • Use the Monte Carlo simulation event kinematics and fold in the tagging efficiencies from data to estimate the number of tagged events • Estimate the ttbar cross section from the excess in the actual number of tagged events with 3 and 4 jets over the background prediction
Semileptonic b-Tagging Efficiency • b-tagging rate is measured purely from dataapplying SVT and Soft Lepton Tagger to two samples: • muon-in-jet • muon-in-jet away jet tagged (enriched in heavy flavor) • Use system8 • Samples with different fractions of signal and background • SVT and SLT have different efficiencies for signal and background • SVT and SLT decorrelated • 8 equations with 8 unknowns • Parameterize in terms of pTjet and yjet Systematic uncertainties arise from the variation of the correlation parameters in System8
b-inclusive (ttbar MC) c-inclusive (ttbar MC) Inclusive Tagging Efficiencies • Inclusive b(c)-tagging efficiency in MC • Measured in ttbar • Calibrated by data-to-MC scale factor given by the ratio of semileptonic b-tagging efficiencies measured in data and bbbar MC Systematic uncertainties on the inclusive efficiencies coming from the difference between parameterizations obtained in ttbar MC with two choices of b-fragmentation models. Systematic uncertainty on semileptonic b efficiency in MC takes as the difference in efficiency between bbbar and ttbar.
Mistag Rate The Negative Tagging Rate is corrected for: • Heavy flavor contamination in QCD data (estimated in QCD MC) • Remaining long lived particles (K0s, L0) not present in the negative tagging rate (estimated in QCD MC) • The mistag rate is then Systematic uncertainties determined by varying by 20% the b and c fractions in PYTHIA QCD MC used for the SFs
Expected number of signal events: Npreselttbar = stheoryttbarxepreselttbarx BR xL • Expected number of non-W background events: Npreseli = stheoryixepreselix BR xL i = single top, diboson (WW, WZ, ZZ) and Ztt Preselection Efficiencies in the e+jets channel • Expected number of W background events: NpreselW = Nsigt - Npreselttbar - S Npreseli Composition of the Preselected Sample • The Matrix Method separates QCD from Physics Backgrounds
b-Tagging Sumary • Estimate the ttbar cross-section from observed excess in the number of tagged events with respect to the background prediction • Optimum use of the statistical information (single and double tags)