Download
1 / 11
110 likes | 259 Views
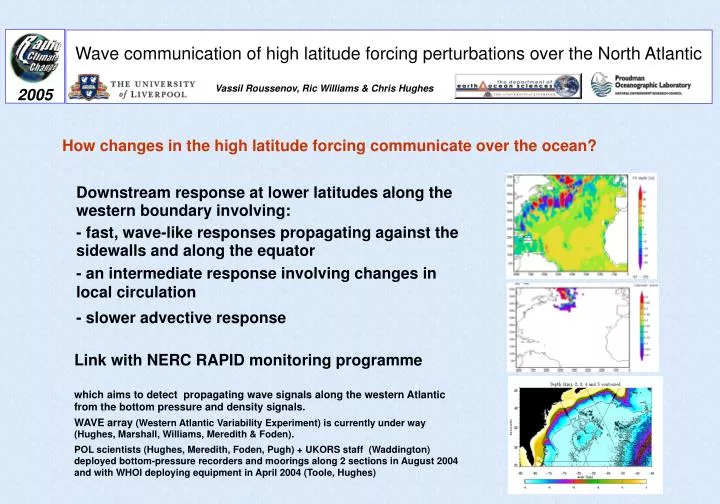
Wave communication of high latitude forcing perturbations over the North Atlantic. Vassil Roussenov, Ric Williams & Chris Hughes. 2005. How changes in the high latitude forcing communicate over the ocean? . Downstream response at lower latitudes along the western boundary involving:

E N D
Wave communication of high latitude forcing perturbations over the North Atlantic Vassil Roussenov, Ric Williams & Chris Hughes 2005 How changes in the high latitude forcing communicate over the ocean? Downstream response at lower latitudes along the western boundary involving: - fast, wave-like responses propagating against the sidewalls and along the equator - an intermediate response involving changes in local circulation - slower advective response Link with NERC RAPID monitoring programme which aims to detect propagating wave signals along the western Atlantic from the bottom pressure and density signals. WAVE array(Western Atlantic Variability Experiment) is currently under way (Hughes, Marshall, Williams, Meredith & Foden). POL scientists (Hughes, Meredith, Foden, Pugh) + UKORS staff (Waddington) deployed bottom-pressure recorders and moorings along 2 sections in August 2004 and with WHOI deploying equipment in April 2004 (Toole, Hughes)
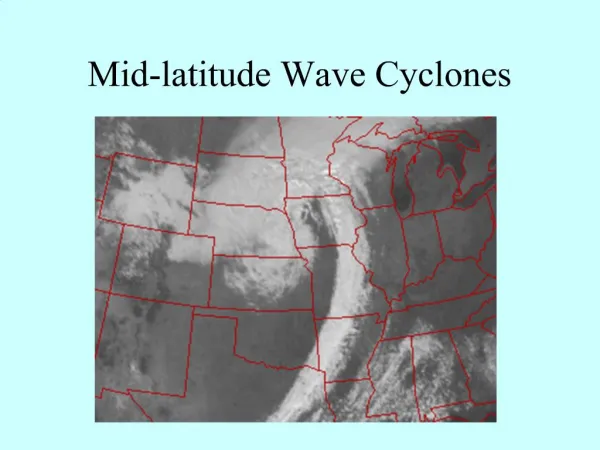
Background Kelvin waves Kawase (1987) suggested, that the deep water spreading is accompanied by fast Kelvin waves, producing tropical sea surface temperature anomalies. Using an idealised model, Johnson and Marshall (2002) demonstrate how overturning changes are communicated through the propagation of fast Kelvin and slower Rossby waves. Wave response Surface layer thickness after an overturning of 10 Sv is switched on at time t = 0 on the northern boundary of the domain (Johnson and Marshall, 2002, JPO) - Topographic Rossby waves - Topographically trapped waves (Mysak, 1980; Huthnance, 1987) Is there any evidence of a similar response in more complex models or in the observations?
Model set-up Model simulations carried out using an isopycnic model (MICOM). Model topography (ETOPO5) Horisontal resolution is 0.28º (30 km at the equator & 15km at 60N), 6 isopycnal layers. Model initialised from Levitus and forced by annual or monthly mean winds for 44 years. Thermohaline forcing is simulated by relaxation of model isopycnals to Levitus within the northern part of the basin. Initial adjustment twin experiment (4years) ECMWF monthly mean wind forcing (44 years) Annual mean winds forcing (44 years) Twin perturbation experiments during the last 4 years, where interfaces raised 120m/10 days over northern relaxation zone. Model tracer released in the relaxation zone.
Initial adjustment movie Model SSH (left) and deep interface pressure (right) anomalies (reference – disturbed fields). No wind forcing; adjustment to the initial vertical stratification. 2 model years movie, year 2-3.
Twin experiment movie Model SSH and bottom pressure anomalies (reference – disturbed fields) from the twin experiment forced by annual mean wind forcing. 4 model years movie, year 41- 44.
Snapshots day 5 Year 3 Model snapshots of the sea surface height anomaly and the depth/pressure of a dense isopycnal • there is a rapid spreading along the western boundary • a slower spreading along the eastern boundary • the SSH and isopycnal height anomalies appear related, but with SSH signals on a slightly broader scale. Year 1 Year 4 Year 2 Year 4 tracer • slow advective response, marked by the Labrador tracer
Correlation patterns Model Altimetry Annual mean winds ECMWF Monthly mean winds Correlation of high pass filtered altimetry everywhere with that averaged in the northern NE Atlantic (100 grid point section 35-36 marked in black dots). Places where correlation is not significant at the 95% level are left white (Hughes & Meredith), Model correlation patterns for SSH with weak and developed background circulation (left panel, initial 4 years of model run with ECMWF monthly forcing; right panel, after 44 years) Signals correlate on western North Atlantic and eastern edge of the North Atlantic Signals correlate along the coast and at low latitudes. Higher correlations in the case of less developed circulation Model results show a broadly similar character to the analytical and altimetric diagnostics.
Propagation of signals along the western boundary Twin experiment time series • fast wave response; range of frequencies; wave interactions, modulation Kelvin waves, topographic Rossby, shelf waves? • Interactions between the waves and the mean current • an intermediate response involving changes in local circulation • slower deep advection green is default, black is perturbed model run, red is Labrador Sea tracer. Hovmueler diagram along the western boundary from years 40-44 (tracer in contours)
Propagation of signals along the western boundary - ECMWF monthly forcing Time series along eastern Atlantic Time series along western Atlantic green – year 1- 4; black – year 40-44 red is Labrador Sea tracer.
Wave interactions Pressure time series spectral analysis Eastern Atlantic Western Atlantic - higher frequency waves filtered by the boundary current - waves modified by the topography and stratification. - lower frequencies and amplitudes along eastern boundary and low latitudes
Conclusions How changes in the high latitude forcing communicate over the ocean? Downstream response at lower latitudes along the western boundary involving: • fast wave responses propagating against the sidewalls and along the equator • interactions between the waves and the mean currents • an intermediate response involving changes in local circulation • slower advective response Map of deployment along 3 sections (thick line in left panel) and mooring schematic (right panel). Future work • higher horisontal and vertical model resolution • precise diagnostics to identify different responses, type of the waves, physical mechanisms • semi-idealised experiments – real topography, simplified forcing, idealised stratification • real forcing simulations in order to link with and support the RAPID monitoring programme The monitoring aims to detect propagating wave signals along the western Atlantic from the bottom pressure and density signals. Thus, the programme aims to understand how overturning signals are communicated.