Download
1 / 30
300 likes | 401 Views
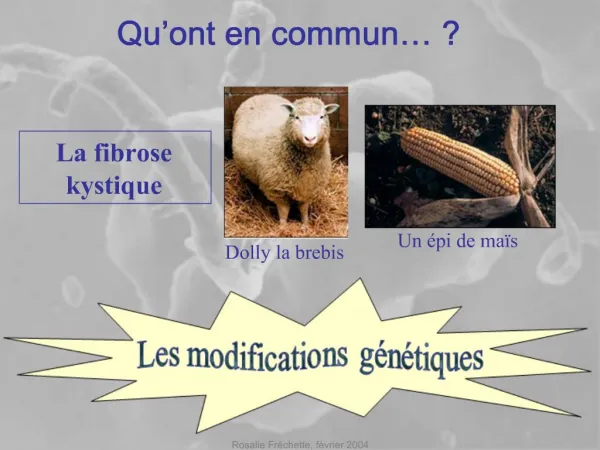
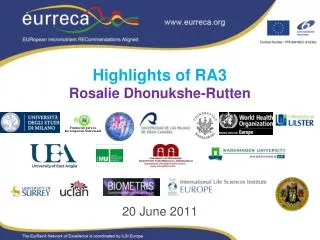
Highlights of RA3 Rosalie Dhonukshe-Rutten. 20 June 2011. Eurreca Chart. Step 4: Collecting available scientific data. Step 5: Integrating the evidence into requirements. Step 6: Deriving dietary reference values from requirements.

E N D
Highlights of RA3Rosalie Dhonukshe-Rutten 20 June 2011
Eurreca Chart Step 4: Collecting available scientific data Step 5: Integrating the evidence into requirements Step 6: Deriving dietary referencevalues from requirements
Two approaches to reach the objective: “Classical” “Association” Maintenance body stores, growth, etc. Health or functional outcome RA3.2 RA3.1 Status / intake biomarker Bioavailability factor (apparent abs) RA3.3 RA3.4 Intake Required intake = Needs / bioavailab. Scaling for age & sex: Based on body size (growth curves) & energy intake (phys act) RA3.2 RA3.4 . NIVs: ANR & INLx, specific for age, sex, life cycle RA3.6 RDAs, PRIs, DRIs, etc RA3.5
What evidence is available? What evidence is available? What evidence can be used? How can the evidence be integrated?
What evidence can be used, and should be integrated? What evidence is available? What evidence can be used, should be integrated? How can the evidence be integrated?
Highlights of results on Vitamin B12Association approach (RA3.1) - RCT’s Intake-Status (RCT’s)Adults & Elderly
Highlights of results on Vitamin B12Association approach (RA3.1) - Observational Intake-Status (Observational)Adults & Elderly
Association approach (RA3.1) Step 5 Integration of evidenceAssociation useful for ANRs (yet identified)Example of vitamin B12
Reflection on association useful for reference values Vitamin B12:yes, mainly I – S adults and elderly (Oct 2012) Iodine:yes, mainly for I – S all population groups (Oct 2012) Iron: yes, I – S pregnant and lactating women (Dec 2012) Zinc: yes, I – S infants, and adults & elderly; I – H infants (Dec 2012) Folate: yes, I – S (Dec 2012)
Classical approachFactorial approachUseful for ANR? Vitamin B12: no, not possible for any of the groups; although information available for additional needs for pregnant and lactating women Iodine:yes, for all population groups Iron: yes, for total (including menstrual) losses, and for growth Zinc: undecided at this stage Folate: in progress
Vitamin B12 • Current intake scenario • ln(median intake) = 1.60 • ln(median status) = 5.72 • median intake = 5 µg/day • median status = 300 pmol/L • Alternative intake scenario • ln(median intake) = 2.53 • ln(median status) = 5.86 • median intake = 12.5 µg/day • median status = 351 pmol/L • By increasing the median vitamin B12 intake with 153% the percentage inadequate intake is expected to decrease from 5.2 % to 2.5 % • regression coeff. 0.16 • correlation coeff. 0.29 95% confidence ellipses x = study medians 150pmol/L 2.5 % 5.2 %
Scaling method within EURRECA 1) scaling based on metabolic turnover 2) scaling by 2-step extrapolation method
Step 7 Evidence for policy options
RA 3.5General Objective Research question: What is the relationship between socioeconomic and cultural factors micronutrient intake and status of EURRECA’s prioritized micronutrients among European population groups? Collate and compare scientific evidence on determinants of low micronutrient intake and status for priority micronutrients in Europe IMR, FIN, WULS-SGGW, KU Leuven, UCLAN, OBU, WHO & WU
RA 3.5 Preliminary Results: Females Indication for inadequacy: intake in lower SES group < ANR
Take home message • Much and great work has been done within RA3! • The results provide good building blocks for setting reference values, modelling: • New evidence: I – S (meta analysis, stochastic modelling) • Complementary: classical approach • Evidence-based, harmonized, transparent • Continue this successful work!
Example scientific result :Immigrants & intake adequacy for selected micronutrients
Example scientific result:Prevalence of inadequate folate intake (% population below ANR) in Europe by gender and population group.
Nogdoen Dia 9, 14, 17, 20, 21, 28, 29 11 eruitlaten of simpelalsvoorbeeld even aanherinneren