Download
1 / 26
260 likes | 408 Views
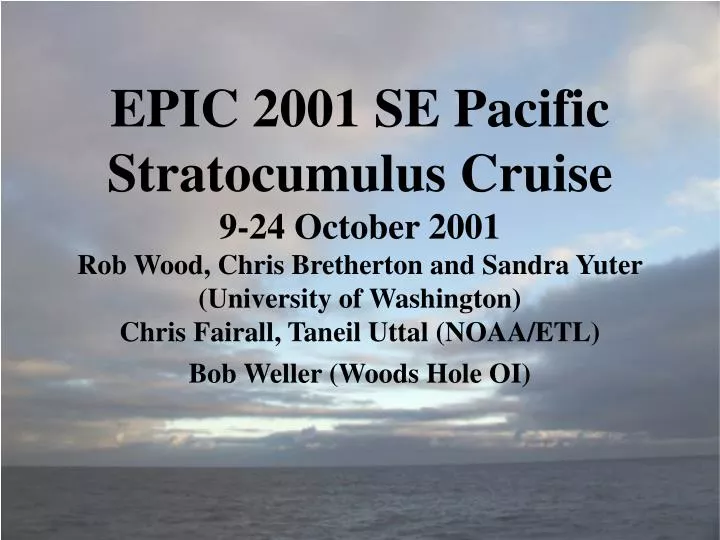
EPIC 2001 SE Pacific Stratocumulus Cruise 9-24 October 2001 Rob Wood, Chris Bretherton and Sandra Yuter (University of Washington) Chris Fairall, Taneil Uttal (NOAA/ETL) Bob Weller (Woods Hole OI). Clouds types, SST and wind stress in the East Pacific. Goals.

E N D
EPIC 2001 SE Pacific Stratocumulus Cruise9-24 October 2001Rob Wood, Chris Bretherton and Sandra Yuter (University of Washington) Chris Fairall, Taneil Uttal (NOAA/ETL)Bob Weller (Woods Hole OI)
Goals Document cloud and boundary layer structure in the SE Pacific Assess the importance of drizzle processes to cloud thickness and extent Compare results with other Sc regimes and with large-scale models Maintain WHOI IMET buoy at 20S 85W
Participants NOAA/ETL (surface met., fluxes, mm radar, lidar)
Participants UNAM (aerosol concentration and characterization)
Participants WHOI (CTDs, IMET buoy)
Participants University of Washington (sondes, 5 cm scanning radar, meth blue, cloud photos)
EPIC Sc cruise 9-24 Oct. 2001
At Buoy q Sharp PBL inversion Cloud base qv Figure by Kim Comstock Radiosonde observations
Cloud top and dBZ (MMCR), base (ceilometer), LCL (surf. met.) cldtop cld base LCL
[m s-1] ECMWF VERTICAL VELOCITY Diurnal Cycle 10 [dBZ] 0 -10
SE PACIFIC [85W, 20S], 1999-2000 LWP [g m-2] LOCAL TIME [hr] Large scale observations of the diurnal cycle of low cloud (cont.) TRMM TMI (microwave imager) observations of LWP Wood, Bretherton, and Hartmann (2002) 0 6 12 18 24
MEAN LWP AMPLITUDE [fraction] TIME OF MAXIMUM LWP • Strongest diurnal cycle of LWP found in the regions of low cloud to the west of continents • Larger amplitudes in southern hemisphere • Peak LWP at 02-06 hr showing diurnal cycle of insolation is key modulator • Summer max. in amplitude Geographical variations 150 100 50 0 0.4 0.3 0.2 0.1 0.0 12 6 0 18 12
0.05 cm s-1 zi/t + u•zi= we - ws Diurnal cycle of subsidencews, entrainmentwe, and zi/t NIGHT DAY NIGHT DAY we dzi/dt ws swe=0.24 cm s-1;sws=0.26 cm s-1;szi/t=0.44 cm s-1
Mixed layer budgets Net radiative flux divergence Free trop. LW SW Entrainment DqT DSL zi qT SL Mixed layer Latent Evap Sensible Heating Precip Ocean
Estimating budget terms cloud radar, ECMWF subsidence, + MODIS BL depth climatology 3hr radiosonde profiles, observed LWP and Fu-Liou radiation scheme • Advection • terms estimated using NCEP and ECMWF reanalyses • Storage terms estimated using sonde profiles Entrainment LW SW zi bulk flux algorithm using Ron Brown met measurements cloud radar + microphysical model LE SH Rain Ocean
Solar absorption and drizzle evaporative stabilization Solar absorption Drizzle evaporaton SW zi Evaporative cooling cooling warming Ocean
Drizzle + solar decoupling? Strong TKE source in cloud Solar Evaporating drizzle suppresses TKE below cloud Drizzle height [m] 2 5 8 11 14 17 20 23 Local time Buoyancy flux
Diurnal cycle of convective velocity scale Drizzle and solar radiation reduce mean w* by comparable amounts
dBZ 0730 0530 Sample of C-band scanning radar and coincident MMCR 20 km
Number/second Z=58R1.1 Meth Blue Rain Rate
Remotely-sensed cloud microphysics (Rob Wood, UW) …UNAM also found a strong diurnal signal in submicron aerosol conc.
250 km 0 50 100 150 200 250 300 g m-2 0 5 10 15 20 25 30 mm SHIP • 3 10 30 100 300 1000cm-3 MODIS 10/16/2001; 10:00 Local (16:00 UTC) Liquid water path Effective radius Droplet concentration
Comparison of 6-day mean 20S 85W profiles with models (Peter Caldwell, UW) • All models (esp CAM) have too shallow a PBL. • CAM2 LWC all in lowest 3 levels (70-630 m). • Observed LWC mainly at 800-1300 m.
Conclusions A remarkable dataset was gathered documenting both spatial and diurnal variability of the SE Pacific Sc regime Pronounced diurnal cycle, amplified by subsidence wave from S America. Mesoscale drizzle cells ubiquitous, especially at night; rain mostly evaporates above surface, sensitive to cloud drop conc. Boundary layer deeper than current global models; well-mixed in early evening but near total shut-down of entrainment in early morning due to combination of solar absorption and drizzle evaporation