Download
1 / 6
60 likes | 185 Views
Lesson 1.2. Identifying Independent/Dependent Variables If you don’t have a graph, just the variables, how do you determine which is the independent and which is the dependent? Questions to ask yourself: Which variable depends on the other? (answer is the dependent variable)

E N D
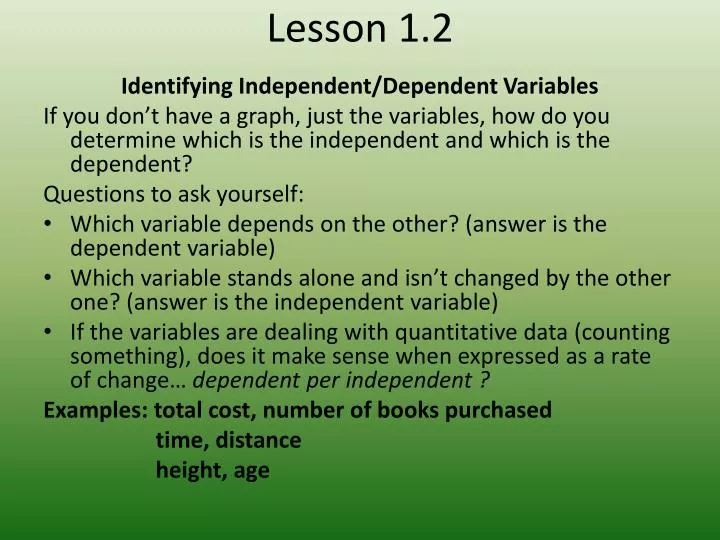
Lesson 1.2 Identifying Independent/Dependent Variables If you don’t have a graph, just the variables, how do you determine which is the independent and which is the dependent? Questions to ask yourself: • Which variable depends on the other? (answer is the dependent variable) • Which variable stands alone and isn’t changed by the other one? (answer is the independent variable) • If the variables are dealing with quantitative data (counting something), does it make sense when expressed as a rate of change… dependent per independent ? Examples: total cost, number of books purchased time, distance height, age
Lesson 1.2 Identify the independent and dependent variables. • total cost of gas, number gallons of gas • perimeter of square, length of a side • total cost of item, change from ten-dollar bill • total calories, number of slices of bread
Lesson 1.2 Choose scales and intervals that you could use to graph the tables. Step 1: Determine the scale. Identify the highest and lowest number for your x-values. Do the same for your y-values. This tells you the minimum and maximum range your scale needs to be for each axis. Step 2: Determine the best interval that fits the scale (go by 1’s, 5’s, ½’s, etc)…..it all depends on your data. If the range of your data is high, then a large interval will be necessary. Note: You want your graph to be drawn in a reasonable amount of space….one graph shouldn’t take up a whole sheet of graph paper.
Lesson 1.2 Choosing appropriate scales and intervals When given data to graph, before you draw your grid you must first decide on appropriate scales and intervals for your x and y axis. Scale – the range of your lowest to highest number Interval – what increments you want your scale to go by
Lesson 1.2 The table to the right shows the effect of a 10 mi/h wind on the wind chill temperature. • What are the independent and dependent variables? • What would be an appropriate scale and interval for Temperature? for Wind Chill? 3. Graph the data. 4. What will the wind chill be when the temperature is 15°F?