Download
1 / 30
300 likes | 456 Views
Quality Improvement in Osteopathic Medical Schools. Presented by: Dr. Mary Pat Wohlford-Wessels Director of Academic Quality & Curricular Affairs Dr. Diane Hills Associate Dean Academic Affairs Dr. David Garloff Associate Dean Clinical Affairs – Site Development Des Moines University

E N D
Quality Improvement in Osteopathic Medical Schools Presented by: Dr. Mary Pat Wohlford-Wessels Director of Academic Quality & Curricular Affairs Dr. Diane Hills Associate Dean Academic Affairs Dr. David Garloff Associate Dean Clinical Affairs – Site Development Des Moines University College of Osteopathic Medicine
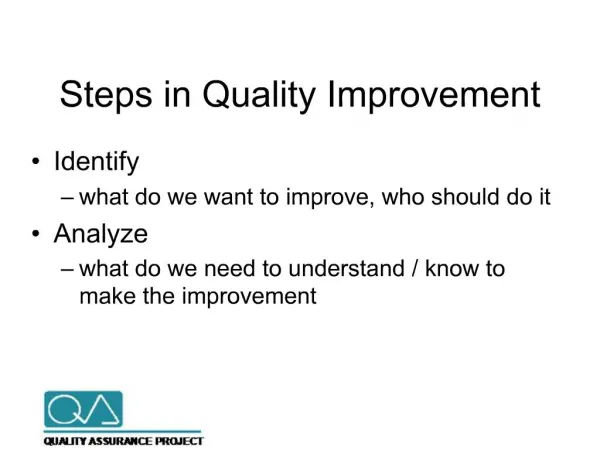
Contents • Introduction • Definition of Quality Improvement • Matrix of requirements • DMU-COM structure • DMU-COM process • DMU-COM data sources • Report Structure
Overview • Virtually everyone in higher education is interested in improving the quality of education provided to students. In fact, to a certain degree, processes that support quality improvement must be in place to meet regional and specialty accreditation standards.
Presentation Rationale • Improving medical education requires systematic processes that support the review and assessment of the work we do. • This presentation will demonstrate how Des Moines University's College of Osteopathic Medicine has developed a comprehensive process that incorporates the work of existing committees, and the use of internal and external data sources to benchmark our work against best practice in Osteopathic Medical Education
Objectives • At the completion of this educational session participants will be able to: • Define Academic Quality • Describe how an academic quality improvement can support internal program review and the requirements of accrediting agencies • Describe how to utilize internal and external (AACOM, NCHEMS, AAMC) data sources to benchmark practice.
Definition of Academic Quality • Dr. Steve Spangehl states: • A quality or a high-performance organization as one that succeeds in satisfying its stakeholders' expectations by meeting or exceeding their needs. • Quality becomes a journey, a search for better ways to understand the changing needs of an organization's stakeholders and for better ways to meet their needs. • Since we can measure the performance of the various processes an organization uses to gauge and meet its stakeholders' needs, improvements are measurable -- although quality itself is not. • The size and regularity of those improvements testify to an organization's quality culture. Used this way, quality ought always to be an adjective, never a noun. • Quality describes an organization that behaves in certain ways -- it focuses upon processes, bases decisions on facts and measurements, looks at itself as an integrated system designed to achieve its ultimate mission and purposes. • http://www.ncacasi.org/
Internal Assessment • Early in the development of the Quality Initiative at DMU, leadership assessed the internal and external requirements related to quality and outcomes. • A matrix was developed and used to guide activities. The objective was NOT to add another layer of activities, but rather to support and enhance existing processes.
DMU-COM Process • COM Performance Improvement Committee meets monthly. • Chair is a faculty member. • The business of the group is directed by a Gantt chart of monthly activities that drive continuous assessment and supports the development of an annual report. • The Committee Chair reports to the faculty at large monthly.
Gantt Chart of Committee Activities Performance Improvement Work Plan – 2005/2006
Improving Medical Education through Data • Institutional Data • AACOM • NBOME • Integrated Post secondary Education Data System (IPEDS) • AAMC • National Center for Higher Education Management Systems (NCHEMS)
Classified Data in Categories • Enrollment Development • Admissions • Costs & Tuition • Student Perceptions • Pre-Clinical Curriculum • Attrition • Clinical Curriculum
Classified Data in Categories • Board Scores • Internship & Residency • Research • Scholarship • Faculty Development • Community Service
Data Use – COMLEX IDifference in DMU-COM Scores and All Peers
Data Use Sources of financial support 1992 – 2002 Reported by AACOM member institutions
Comparison of Results Using Two Different Analysis Techniques - I TECHNIQUE 1 First, Second, Third Choice Reasons For Attending COMS N = 101
Comparison of Results Using Two Different Analysis Techniques - II TECHNIQUE 2 The above data was recoded to be able to rank the reason(s) why students chose DMU. Responses were recoded to a Likert scale as follows: 4 = extremely important (3.50 – 4) 3= very important (2.50 – 3.49) 2 = important (1.50 – 2.49) 1 = not important (1 – 1.49) Reliability Coefficients N of Cases = 101.0 Alpha = .93 The utilization of the second technique provides additional data and helps target improvement activities. Tracking the gender and ethnicity of respondents will further assist COM in making decisions regarding improvement.
Performance Improvement Report • Developed annually • Distributed to program stakeholders • 2004 report - represented years 1-4 • Admission • Pre-clinical • Clinical • Residency • 2005 report – organized using Baldrige Education Criteria
Baldrige Education Criteria • Leadership • Strategic Planning • Student, Stakeholder, Market Focus • Measurement, Analysis and Knowledge Management • Faculty and Staff Focus • Process Management • Research (not an official Baldrige Category) • Performance Results • http://www.quality.nist.gov/
Conclusion • Performance improvement at DMU has been a journey beginning years ago with student outcomes assessment. • The process has evolved into a comprehensive system that includes multiple stakeholders all focused on improving the quality of the organizational culture and ultimately the performance of our graduates.
Who to Contact If you have additional questions about the QI program and/or processes at DMU, please contact: Dr. Mary Pat Wohlford-Wessels Director, Academic Quality and Curricular Affairs 515 271-1636 Mary.Wohlford-Wessels@dmu.edu