Download
1 / 20
200 likes | 307 Views
Debugging and Performance Analysis of Parallel MPI Applications. Edgar Gabriel. Debugging sequential applications. Several ways how to debug a sequential application: printf() statements in the source code Works, works reliably, painful to remove afterwards assert() statements

E N D
Debugging and Performance Analysis of Parallel MPI Applications Edgar Gabriel
Debugging sequential applications • Several ways how to debug a sequential application: • printf() statements in the source code • Works, works reliably, painful to remove afterwards • assert() statements • check for a certain value of a variable. If the expression is false, the application aborts. • only active, if the macro NDEBUG is defined • Setting in the source #define NDEBUG 1 • Compiling with the flag –DNEDBUG=1 #include <assert.h> void open_record(char *record_name) { assert (record_name!=NULL); }
Using a debugger • For a source file to be visible in the debugger, you have to compile the source code with the –g option, e.g. gabriel@salmon>mpicc –g –o test test.c • Avoid using optimization flags, such as –O3 when you would like to debug the code • Two types of debugger • Command line debugger, such as gdb • Graphical debuggers, such as ddd (which is a GUI to gdb)
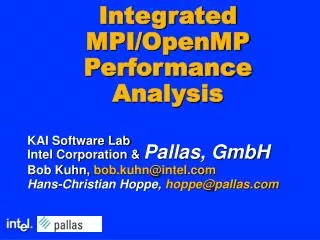
Load application into the debugger Start app. Debugger points to the problem Show source code of app. Show the value of a variable when the problem occurred
gdb commands • Setting breakpoints: debugger stops execution at the specified line. Example (gdb) break errexample.c:10 (gdb) break myfunct • Stepping through the source code (gdb) next (skips subroutines/functions) (gdb) step (enters subroutines/functions) • Continue execution (not step by step anymore) (gdb) cont • Quit debugger (gdb) quit
Debugging a parallel application • Some debuggers for parallel applications available (e.g. totalview, ddt) • Unfortunately expensive products • You can still use printf and assert • Output from several processes will be mixed • you should put the rank of the process in front of each printf statement • gdb or ddd still useable • You have to choose which process you would like to debug • Please be aware, that ddd or gdb can only see processes on the local machine
Debugging a parallel application (II) • Hints for parallel debugging • Try to find the lowest number of processes for which the problem still occurs • Try to execute the application on a single node • If the problem does not show up on a single node, you will have to run the application on multiple nodes and login to the node, where the problem occurs • Introduce a sleep () statement in your application to have time to attach with a debugger
Attaching to a process • Menu File • Bullet: attach to processes • Choose the PID which you would like to debug
Debugging parallel applications (III) • Some MPI libraries support the startup of a debugger in the mpirun command • e.g. Open MPI mpirun –np 2 ddd ./colltest • Starts one ddd session per process • Not useful for large numbers of processes
Performance Analysis of parallel applications • Sometimes, it is useful to see • Who is communicating with whom and how much • How are the messages and the processes synchronized • General approach: link a (tracing) library to your application which records • per process and per MPI function • when the function has been started and how long it took ( two time-stamps) • Some additional information, e.g. for Send operations source and destination process, message length, communicator etc.
Performance Analysis of parallel applications • The mechanism used to do that is called MPI Profiling Interface • MPI defines, that each function has to be available not only with the prefix MPI but also with the prefix PMPI • e.g. instead of MPI_Send you could also call PMPI_Send, • same functionality just different name • Tracing libraries implement the MPI function and call internally the PMPI function for the ‘real’ operation
Profiling interface • Example: an application calls MPI_Send • Usual scenario: the function MPI _Send is implemented in the MPI library • Profiling scenario: • the function MPI_Send is implemented in the tracing library. • The MPI_Send function of the tracing library calls PMPI_Send • PMPI_Send is implemented in the MPI library
Profiling interface (II) • Question: How does the application now which MPI_Send function to use (e.g. from MPI library or from tracing library)? • Answer: You tell the application at link-time • Example: mpicc –o test test.c is in reality (for Open MPI) cc –o test test.c –I/home/gabriel/OpenMPI/include –L/home/gabriel/OpenMPI/lib –lmpi –lorte -lopal
Profiling interface (III) • The –I option with cc: tells the compiler where to look for header files • The –L option tells the linker where to look for libraries • Linker searcher the directories in the order as specified by the user • If a function has been found in a library, the linker does not continue searching in the following libraries (usually!) • Thus cc –o test test.c –I/home/gabriel/OpenMPI/include –L/home/gabriel/OpenMPI/lib –lmpi –lorte -lopal will use MPI_Send from lmpi, because that’s where the linker finds the function first
Profiling interface (IV) • However, cc –o test test.c –I/home/gabriel/OpenMPI/include -L/home/gabriel/MPE/lib –llmpe –lmpe –L/home/gabriel/OpenMPI/lib –lmpi –lorte -lopal • will use MPI_Send from llmpe, because that’s where the linker finds the function first • but PMPI_Send from lmpi, because that’s where the linker finds the function first.
Available performance analysis tools • Commercials (among others) • Vampir and vampirtrace • Paraver and mpilog • Public domain (among others) • MPE and jumpshot • CUBE and EPILOG
Hints when using MPE and jumpshot • When using MPE, you can use instead of the long commandline a wrapper-script called mpecc/mpef77, e.g. gabriel@linux12>mpecc –mpilog –o test.mpe test.c • Run the application as usually gabriel@linux12>mpirun –np 2 ./test.mpe • After the run, there is file called test.mpe.clog2 in the same directory • The viewer (jumpshot) unfortunately needs a different file format, so you have to convert it with gabriel@linux12>clog2TOslog2 test.mpe.clog2 • This generates a file called test.mpe.slog2 • You can load an slog2 file into jumpshot
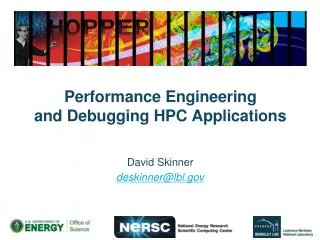
Example of an analysis with VAMPIR (I) Timeline view – see which process is at which time in which MPI function
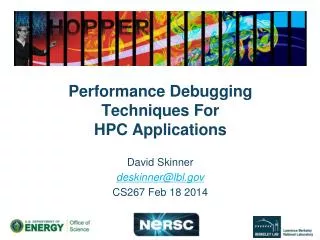
Example of an analysis with VAMPIR (II) Message statistics view – how much data is being sent between processes