Download
1 / 11
110 likes | 314 Views
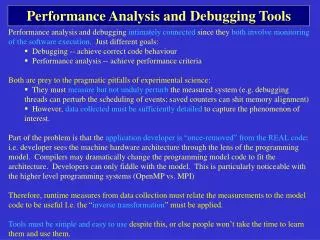
Performance Analysis and Debugging Tools. Performance analysis and debugging intimately connected since they both involve monitoring of the software execution . Just different goals: Debugging -- achieve correct code behaviour Performance analysis -- achieve performance criteria

E N D
Performance Analysis and Debugging Tools Performance analysis and debugging intimately connected since they both involve monitoring of the software execution. Just different goals: • Debugging -- achieve correct code behaviour • Performance analysis -- achieve performance criteria Both are prey to the pragmatic pitfalls of experimental science: • They must measure but not unduly perturb the measured system (e.g. debugging threads can perturb the scheduling of events; saved counters can shit memory alignment) • However, data collected must be sufficiently detailed to capture the phenomenon of interest. Part of the problem is that the application developer is “once-removed” from the REAL code: i.e. developer sees the machine hardware architecture through the lens of the programming model. Compilers may dramatically change the programming model code to fit the architecture. Developers can only fiddle with the model. This is particularly noticeable with the higher level programming systems (OpenMP vs. MPI) Therefore, runtime measures from data collection must relate the measurements to the model code to be useful I.e. the “inverse transformation” must be applied. Tools must be simple and easy to use despite this, or else people won’t take the time to learn them and use them.
Performance Analysis Object is to minimise wall time in general. Hopefully, did performance analysis earlier to remove major problems and therefore just looking for: • Hotspots -- places where the code spends a lot of time necessarily -- make these as efficient as possible • Bottlenecks -- places where the code spends a lot of time unnecessarily -- remove these Four basic performance data collection techniques: • Timers : simple command line timing utilities, Fortran/C timing utilities • Profilers record the amount of time spent in different parts of a program. Profiles typically are gathered automatically. • Counters record either frequencies of events or cumulative times. The insertion of counters may require some programmer intervention (extrinsic or intrinsic) • Eventtracers record each occurrence of various specified events, thus typically producing a large amount of data. Tracers can be produced either automatically or with programmer intervention (xtrinsic and intrinsic) Then often require data transformation -- extract useful information from vast amount of data collected. And then data visualisation to interpret the distilled results. Generally, an iterative process!
Performance Analysis When selecting a tool for a particular task, the following issues should be considered: 1. Accuracy. In general, performance data obtained using sampling techniques are less accurate than data obtained by using counters or timers. In the case of timers, the accuracy of the clock must be taken into account (low clock accuracy, high clock overhead). 2. Simplicity. The best tools in many circumstances are those that collect data automatically, with little or no programmer intervention, and that provide convenient analysis capabilities. 3. Intrusiveness. Unless a computer provides hardware support, performance data collection inevitably introduces some overhead. We need to be aware of this overhead and account for it when analyzing data. Not just time shift: e.g. setting breakpoint in MPI can change the order in which receives gets sent mssages. “Uncertainty principle”.
Performance Analysis # The most important goal of performance tuning is to reduce a program's wall clock execution time. Reducing resource usage in other areas, such as memory or disk requirements, may also be a tuning goal. # Performance tuning is an iterative process used to optimize the efficiency of a program. It usually involves finding your program's hot spots and eliminating the bottlenecks in them. * Hot Spot: An area of code within the program that uses a disproportionately high amount of processor time. * Bottleneck: An area of code within the program that uses processor resources inefficiently and therefore causes unnecessary delays. # Performance tuning usually involves profiling - using software tools to measure a program's run-time characteristics and resource utilization. # Use profiling tools and techniques to learn which areas of your code offer the greatest potential performance increase BEFORE you start the tuning process. Then, target the most time consuming and frequently executed portions of a program for optimization.
Performance Analysis # Consider optimizing your underlying algorithm: an extremely fine-tuned O(N * N) sorting algorithm may perform significantly worse than a untuned O(N log N) algorithm. # Finally, know when to stop - there are diminishing returns in successive optimizations. Consider a program with the following breakdown of execution time percentages for the associated parts of the program: A 20% increase in the performance of procedure3() results in a 10% performance increase overall. A 20% increase in the performance of main() results in only a 2.6% performance increase overall.
Timers Shell: time timex mon (mon -top, mon -smp), ps, netstat C/C++: gettimeofday read_real_time Fortran: rtc irtc etime etime MPI: MPI_WTIME
Standard Unix Profilers Prof Basically, percentage of CPU used by each procedure Compile with the “-p” option Produces files “mon.out.*” Type “prof -m mon.out.*” (-m = merge) or “prof mon.out.n” for individual stats on each processor Gprof Same thing except profiles according to call graphs i.e. it gives percentages for procedure and all child procedures -- timing includes timing for embedded calls further down the call tree. Compile with “-pg” Produces files “gmon.out.*” Type “gprof -m mon.out.*” or “gprof mon.out.n” Xprofiler (not standard? IBM only?) Xwindows graphical processor Compile and link with “-g -pg” Produces gmon files Type “xprofiler myprog gmon.out.*” (uncluster functions, hide libraries, zoom in)
Counters Lot of vendors provide “on-chip” hardware counters these days and these can be accessed and read. e.g. Cray/IBM Power series -- Hardware performance monitor HPM: Gives clock cycles, instructions completed, load/store cache misses … Run executable with “hpmcount -o outputfile myprog” Examine results with “perf outfile”
Commercial/vendor tracing tools Vampir -- event-trace visualisation using MPI traces (regular MPI) Jumpshot -- event-trace visualisation using MPI traces (MPICH/MPE) MPI_trace Paragraph Paraver/Dimemas -- MPI/OpenMP, Linux Pablo -- Instrumentation and perf analysis of C, F77, F90 and HPF IBM AIX parallel environment Paradyn Pgprof Peekperf
Debugging Tools Parallel computing means that software bugs may arise from the complex interactions of the large number of parallel software components. These bugs may have high latency -- i.e. they don’t manifest themselves until sometime after they were caused. They may also be subtly dependent on timing conditions that are not easily reproducible. • Debugging can be extremely time consuming and tedious! Some tips for avoiding having to debug: • Implicit none • Comment/indent/etc -- write readable code • Use CVS -- version update system Tools: Print statements still often the best way to go! Breakpoint debuggers: Dbx -- ouch Totalview -- all singing, all dancing commercial software. Pray it is on your system!
Visualisation Tool : VAPOR Visualisation and Analysis Platform for Oceanographic/atmospheric/solar-physics Research John Clyne, Alan Norton: NCAR Scientific Visualization Lab Volume renderer: Assigns a colour value and an opacity value to each value of a scalar variable. Creates a translucent “cloud” of the variable. Much better than isosurfaces. Contours and isosurfaces too Flow visualisation with streamlines, streaklines, magnetic field lines. Animation for movies ** Ability to interact directly with IDL to create new fields etc. http://www.vapor.ucar.edu