Download
1 / 32
320 likes | 333 Views
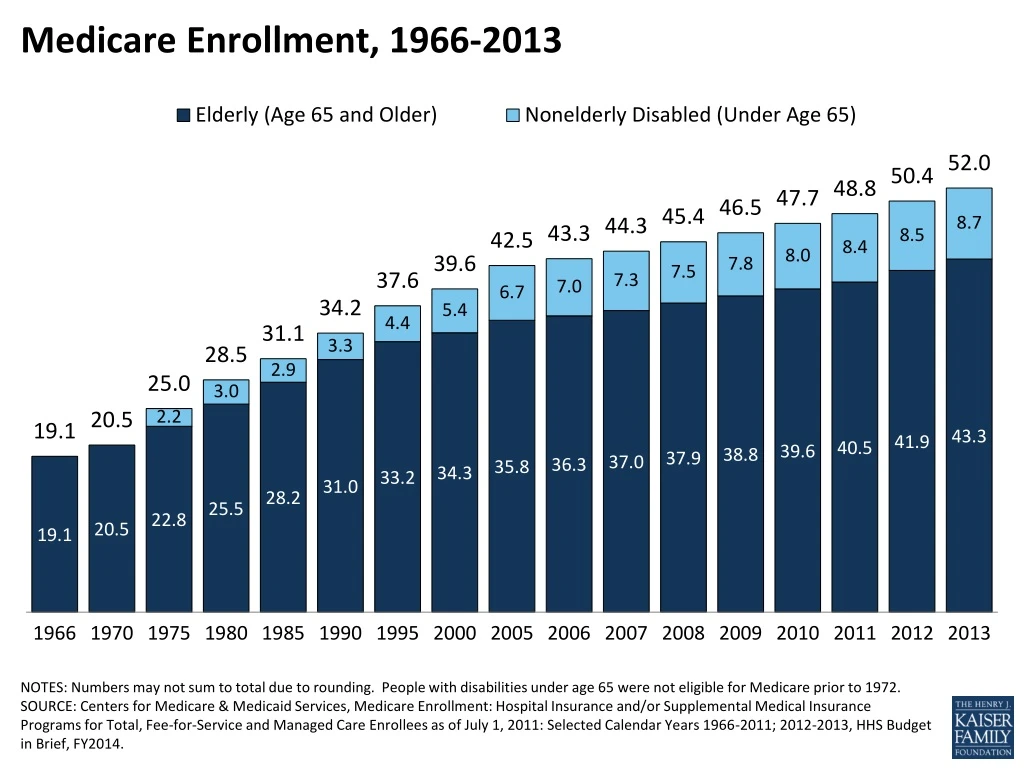
Medicare Enrollment, 1966-2013. NOTES: Numbers may not sum to total due to rounding. People with disabilities under age 65 were not eligible for Medicare prior to 1972.

E N D
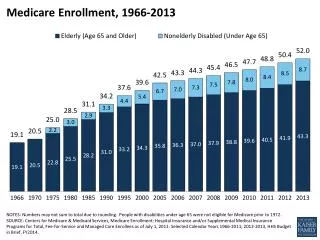
Medicare Enrollment, 1966-2013 NOTES: Numbers may not sum to total due to rounding. People with disabilities under age 65 were not eligible for Medicare prior to 1972. SOURCE: Centers for Medicare & Medicaid Services, Medicare Enrollment: Hospital Insurance and/or Supplemental Medical Insurance Programs for Total, Fee-for-Service and Managed Care Enrollees as of July 1, 2011: Selected Calendar Years 1966-2011; 2012-2013, HHS Budget in Brief, FY2014.
Medicare Beneficiaries as a Percent of State Populations, 2012 National Average, 2012 = 16% SOURCE: Calculation based on Kaiser Family Foundation analysis of the CMS State/County Market Penetration file, March 2012; and 2011 population estimates from the United States Census Bureau.
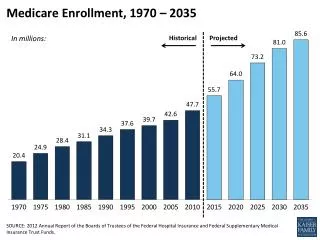
Medicare Enrollment, 1970-2035 In millions: Historical Projected SOURCE: 2013 Annual Report of the Boards of Trustees of the Federal Hospital Insurance and Federal Supplementary Medical Insurance Trust Funds.
Projected Change in Medicare Enrollment, 2000-2050 Medicare Enrollment (in millions) Average Annual Growth in Enrollment SOURCE: 2013 Annual Report of the Boards of Trustees of the Federal Hospital Insurance and Federal Supplementary Medical Insurance Trust Funds.
Characteristics of the Medicare Population Percent of total Medicare population: NOTE: ADL is activity of daily living. SOURCE: Urban Institute and Kaiser Family Foundation analysis, 2012; Kaiser Family Foundation analysis of the Centers for Medicare & Medicaid Services Medicare Current Beneficiary 2009 Cost and Use file.
Median Income Among Medicare Beneficiaries, Overall and by Race/Ethnicity, Age, and Gender, 2012 Race /Ethnicity Age Gender SOURCE: Urban Institute analysis of DYNASIM for the Kaiser Family Foundation.
Distribution of Medicare Beneficiaries by Income Level, 2012 5%had incomes above $88,900 50% had incomes below $22,500 25% had incomes below $14,000 NOTE: Total household income for couples is split equally between husbands and wives to estimate income for married beneficiaries. SOURCE: Urban Institute analysis of DYNASIM for the Kaiser Family Foundation.
Medicare Beneficiaries’ Utilization of Selected Medical and Long-Term Care Services, 2009 Percent of total Medicare population: SOURCES: Kaiser Family Foundation analysis of the Centers for Medicare & Medicaid Services Medicare Current Beneficiary 2009 Cost and Use file.
Standard Medicare Prescription Drug Benefit, 2013 CATASTROPHIC COVERAGE CatastrophicCoverage Limit = $6,955 in Estimated Total Drug Costs Enrolleepays 5% Plan pays 15%; Medicare pays 80% Brand-name drugsEnrollee pays 47.5%; Plan pays 2.5%50% manufacturer discount Generic drugs Enrollee pays 79%; Plan pays 21% COVERAGE GAP Initial Coverage Limit = $2,970 in Total Drug Costs Enrollee pays 25% INITIAL COVERAGE PERIOD Plan pays 75% Deductible = $325 DEDUCTIBLE NOTE: *Amount corresponds to the estimated catastrophic coverage limit for non-LIS enrollees ($6,734 for LIS enrollees), which corresponds to TrOOP spending of $4,750.SOURCE: Kaiser Family Foundation illustration based on CMS standard benefit parameter update for 2013. Amounts rounded to nearest dollar.
Number of Medicare Part D Stand-Alone Prescription Drug Plans, by State, 2013 U.S. Total, 2013= 1,031 SOURCE: Kaiser Family Foundation analysis of Centers for Medicare & Medicaid Services (CMS) PDP landscape source file, 2013.
Prescription Drug Coverage Among Medicare Beneficiaries in 2013 6% Total Medicare Enrollment in 2013= 52.3 millionTotal Part D Enrollment (excluding employer subsidy) = 35.7 million NOTE: Does not sum to 100% due to rounding. LIS is low-income subsidy. Total Part D and Medicare enrollment based on 2012 intermediate estimates. SOURCE: 2013 Annual Report of the Boards of Trustees of the Federal Hospital Insurance and Federal Supplementary Medical Insurance Trust Funds.
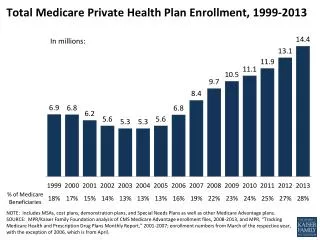
Total Medicare Private Health Plan Enrollment, 1999-2013 In millions: NOTE: Includes MSAs, cost plans, demonstration plans, and Special Needs Plans as well as other Medicare Advantage plans. SOURCE: MPR/Kaiser Family Foundation analysis of CMS Medicare Advantage enrollment files, 2008-2013, and MPR, “Tracking Medicare Health and Prescription Drug Plans Monthly Report,” 2001-2007; enrollment numbers from March of the respective year, with the exception of 2006, which is from April.
Distribution of Enrollment in Medicare Advantage Plans, by Plan Type, 2013 Total Medicare Advantage Enrollment, 2013 = 14.4 Million NOTE: PFFS is Private Fee-for-Service plans, PPOs are preferred provider organizations, and HMOs are Health Maintenance Organizations. Other includes MSAs, cost plans, and demonstration plans. Includes enrollees in Special Needs Plans as well as other Medicare Advantage plans. SOURCE: MPR / KFF analysis of the Centers for Medicare and Medicaid Services (CMS) Medicare Advantage enrollment files, 2013.
Share of Medicare Beneficiaries Enrolled in Medicare Advantage Plans, by State, 2013 National Average, 2013 = 28% NOTE: Includes MSAs, cost plans and demonstrations. Includes Special Needs Plans as well as other Medicare Advantage plans. SOURCE: MPR/Kaiser Family Foundation analysis of CMS State/County Market Penetration Files, 2013.
Dually eligible beneficiaries comprise 20% of the Medicare population and 15% of the Medicaid population, 2008 Dual Eligibles 9 million Medicare 37 million Medicaid 51 million Total Medicare beneficiaries, 2008: 46 million Total Medicaid beneficiaries, 2008: 60 million SOURCE: Kaiser Family Foundation analysis of the Medicare Current Beneficiary Survey 2008, and Kaiser Commission on Medicaid and the Uninsured and Urban Institute estimates based on data from FY2008 MSIS and CMS Form-64.
Dual eligible beneficiaries as a share of Medicare and Medicaid population and spending, 2008 Dual Eligibles as a Share of the Medicare Population and Medicare Spending, 2008: Dual Eligibles as a Share of the Medicaid Population and Medicaid Spending, 2008: Total Medicare Population, 2008:46 Million Total Medicare Spending, 2008:$424 Billion Total Medicaid Population, 2008: 60 Million Total Medicaid Spending, 2008:$330 Billion SOURCE: Kaiser Family Foundation analysis of the CMS Medicare Current Beneficiary Survey Cost and Use File, 2008, and Kaiser Commission on Medicaid and the Uninsured and Urban Institute estimates based on data from FY2008 MSIS and CMS Form-64.
Sources of Supplemental Coverage Among Medicare Beneficiaries, 2009 No Supplemental Coverage Total Number of Beneficiaries, 2009: 47.2 Million NOTE: Numbers do not sum due to rounding. SOURCE: Kaiser Family Foundation analysis of the Centers for Medicare & Medicaid Services Medicare Current Beneficiary Survey, 2009 Cost and Use file.
Median Out-of-Pocket Health Care Spending As a Percent of Income Among Medicare Beneficiaries, 1997-2006 Total health care out-of-pocket Premium out-of-pocket Nonpremiumout-of-pocket NOTES: Differences between 1997 and 2006 are statistically significant for all displayed measures. Annual amounts for the components of total health care spending do not sum to total amounts because values shown are median, not mean, values. SOURCE: Kaiser Family Foundation analysis of CMS Medicare Current Beneficiary Survey Cost and Use files, 1997-2006.
Out-of-Pocket Health Care Spending As a Percent of Income Among Medicare Beneficiaries, By Spending Percentile, 1997-2006 90th percentile 75th percentile 50th percentile (median) NOTES: Differences between 1997 and 2006 are statistically significant for all displayed measures. SOURCE: Kaiser Family Foundation analysis of CMS Medicare Current Beneficiary Survey Cost and Use files, 1997-2006.
Part B and Part D Out-of-Pocket Spending as a Share of Average Social Security Benefit, 1970-2010 NOTE: SMI is Supplementary Medical Insurance. Out-of-pocket spending includes SMI (Part B and Part D) premiums and out-of-pocket cost-sharing expenses for SMI covered services. SOURCE: Kaiser Family Foundation analysis based on data from 2012 Annual Report of the Boards of Trustees of the Federal Hospital Insurance and Federal Supplementary Medical Insurance Trust Funds.
Distribution of Average Household Spending by Medicare and Non-Medicare Households, 2010 Medicare Household Spending Non-Medicare Household Spending Transportation Health Care 5% Transportation Health Care Average Household Spending = $30,818 Average Household Spending = $49,641 SOURCE: Kaiser Family Foundation analysis of the Bureau of Labor Statistics Consumer Expenditure Survey Interview and Expense Files, 2010.
Medicare as a Share of the Federal Budget, 2012 Total Federal Spending, FY2012 = $3.5 Trillion Federal Spending on Medicare, FY2012 = $551 Billion NOTE: FY is fiscal year. 1Amount for Medicare excludes offsetting premium receipts (premiums paid by beneficiaries, amount paid to providers and later recovered, and state contribution (clawback) payments to Medicare Part D). 2Other category includes other mandatory outlays, offsetting receipts, and negative outlays for Troubled Asset Relief Program (TARP). SOURCE: Congressional Budget Office (CBO) Medicare Baseline, May 2013.
Projected Medicare Spending, 2013-2023 In billions: SOURCE: Congressional Budget Office (CBO) Medicare Baseline, May 2013.
Medicare as a share of Federal Budget Outlays, and as a share of Gross Domestic Product (GDP), 1990-2020 Medicare Spending as a Share of Federal Budget Outlays Medicare Spending as a Share of Gross Domestic Product (GDP) SOURCE: CBO Budget and Economic Outlook, January 2011 (for 1990-2010 data) and May 2013 (for 2020 data).
Medicare Benefit Payments By Type of Service, 2012 Part A Part B Part A and B Part C Part D Skilled Nursing Facility Hospital Outpatient Services Home Health Total Benefit Payments = $536 billion NOTE: Excludes administrative expenses and is net of recoveries. *Includes hospice, durable medical equipment, Part B drugs, outpatient dialysis, ambulance, lab services, and other services. SOURCE: Congressional Budget Office (CBO) Medicare Baseline, May 2013.
Medicare’s Share of National Personal Health Expenditures, by Type of Service, 2012 NOTE: Total also includes dental care, durable medical equipment, other professional services, and other personal health care/products. SOURCE: Centers for Medicare & Medicaid Services, Office of the Actuary, National Health Expenditure Projections 2011-2021, June 2012.
Distribution of Traditional Medicare Beneficiaries and Medicare Spending, 2009 Average per capita Traditional Medicare spending: $9,702 Average per capita Traditional Medicare spending among top 10%: $55,763 Average per capita Traditional Medicare spending among bottom 90%: $4,584 Total Number of Traditional Medicare Beneficiaries: 35.4 million Total Traditional Medicare Spending: $343 billion NOTES: Excludes Medicare Advantage enrollees. Includes noninstitutionalized and institutionalized beneficiaries. SOURCE: Kaiser Family Foundation analysis of the CMS Medicare Current Beneficiary Survey Cost and Use File, 2009.
Annual Change in Per Enrollee Medicare and Private Health Insurance Spending, 1970-2011 Annual Percent Change Medicare Private Health Insurance NOTE: Comparison includes benefits commonly covered by Medicare and Private Health Insurance. These benefits are hospital services, physician and clinical services, other professional services and durable medical products. SOURCE: Centers for Medicare & Medicaid Services, Office of the Actuary, National Health Statistics Group: National Health Expenditure Historical Data, 2013.
Sources of Medicare Revenue, 2012 NOTE: Numbers may not sum due to rounding. Amounts are fiscal year totals. SOURCE: 2013 Annual Report of the Boards of Trustees of the Federal Hospital Insurance and Federal Supplementary Medical Insurance Trust Funds.
Historical and Projected Average Annual Growth Rate in Medicare Spending Per Capita and Other Measures Projected (2012-2021) Actual (2000-2011) NOTE: *Assumes no reduction in physician fees under Medicare between 2012 and 2021. SOURCES: Kaiser Family Foundation analysis of data from Boards of Trustees, Congressional Budget Office, Centers for Medicare & Medicaid Services, U.S. Census Bureau.
Medicare Part A Trust Fund Balance at Beginning of the Year, as a Percentage of Annual Expenditures, 2012-2026 In billions: SOURCE: 2013 Annual Report of the Boards of Trustees of the Federal Hospital Insurance and Federal Supplementary Medical Insurance Trust Funds.
Solvency Projections of the Medicare Part A Trust Fund, 1970-2013 Projected Number of Years to Insolvency and Projected Year of Insolvency: Year of Trustees’ Report NOTES: ‘Insolvency’ refers to the depletion of the trust fund. No insolvency projections were made for 1973-1975 and 1989. For all other years not displayed, the Hospital Insurance Trust Fund was projected to remain solvent for 17 or fewer years. SOURCE: Intermediate projections from 1970-2013 Annual Reports of the Boards of Trustees of the Federal Hospital Insurance and Federal Supplementary Medical Insurance Trust Funds.