1 / 1

Total Medicare Advantage Enrollment, 1992-2014

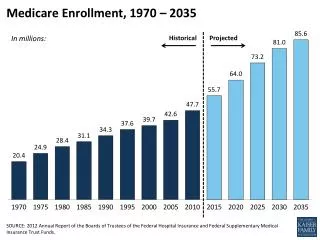
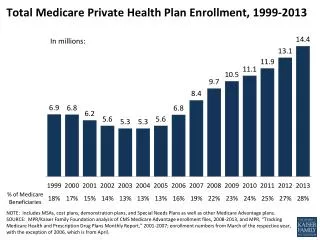
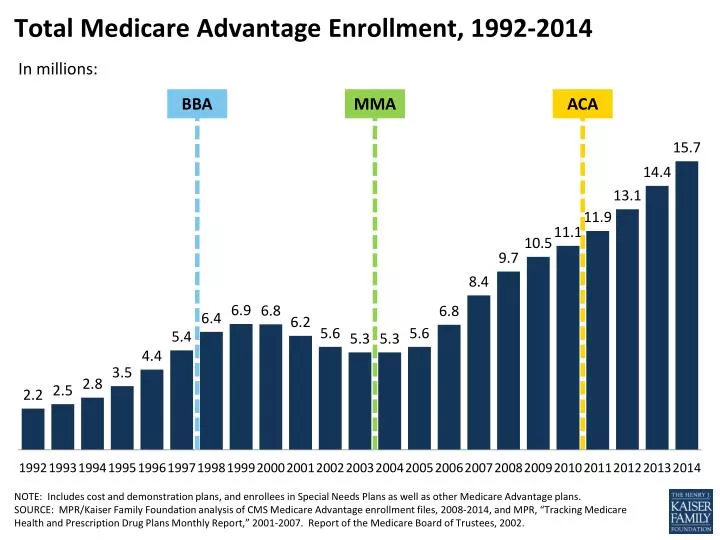
Total Medicare Advantage Enrollment, 1992-2014. In millions:. BBA. MMA. ACA. NOTE: Includes cost and demonstration plans, and enrollees in Special Needs Plans as well as other Medicare Advantage plans.

nam
Download Presentation

Total Medicare Advantage Enrollment, 1992-2014

An Image/Link below is provided (as is) to download presentation Download Policy: Content on the Website is provided to you AS IS for your information and personal use and may not be sold / licensed / shared on other websites without getting consent from its author. Content is provided to you AS IS for your information and personal use only. Download presentation by click this link. While downloading, if for some reason you are not able to download a presentation, the publisher may have deleted the file from their server. During download, if you can't get a presentation, the file might be deleted by the publisher.

E N D

Presentation Transcript


  1. Total Medicare Advantage Enrollment, 1992-2014 In millions: BBA MMA ACA NOTE: Includes cost and demonstration plans, and enrollees in Special Needs Plans as well as other Medicare Advantage plans. SOURCE: MPR/Kaiser Family Foundation analysis of CMS Medicare Advantage enrollment files, 2008-2014, and MPR, “Tracking Medicare Health and Prescription Drug Plans Monthly Report,” 2001-2007. Report of the Medicare Board of Trustees, 2002.

More Related