Download
1 / 8

E N D
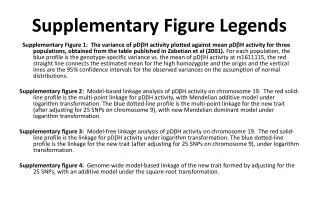
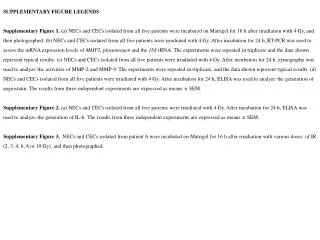
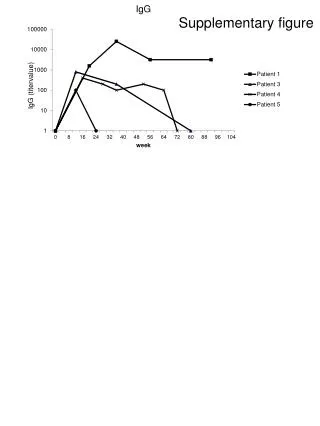
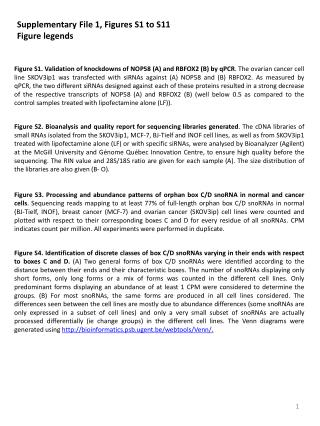
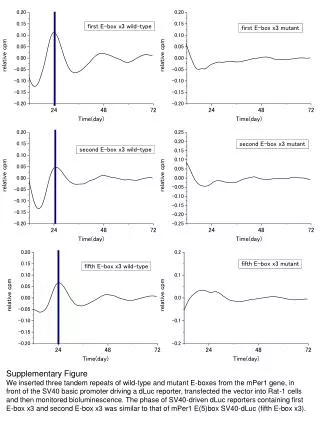
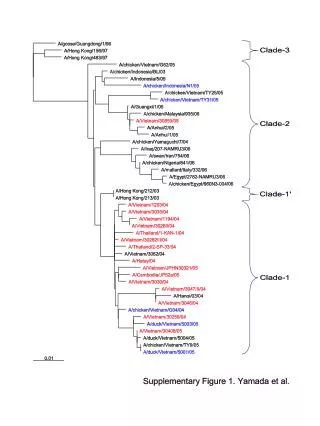
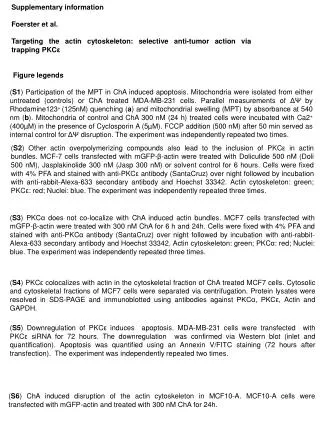
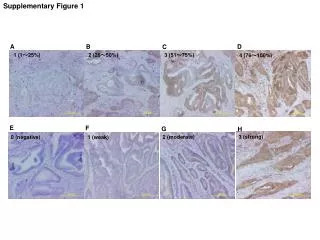
Supplementary Figure Legends Table 1. Univariate analysis of phosphoprotein markers used in the study. Cutpoints for survival were selected using Xtile (see materials and methods) and minimum p-values corrected to minimise Type I error. Only variables with p<0.05 after Monte-Carlo simulation were considered significant. Figure 1.Phosphoprotein expression of the five genetic pathway markers between histological subtypes in cohort 1 (p-values; Kruskal-Wallis test). Figure 2. Unsupervised clustering of the five genetic pathway markers in cohort 2 reveals two main clusters (A), which do not differ with respect to prognosis. While patients with cluster 1 tumours have a worse outcome when treated with taxanes (log-rank p=0.031), this is not significant in multivariate analysis. Figure 3.Unsupervised cluster analysis of cohort 1 tumours shows two main clusters with similar profiles of expression as in cohort 2. Figure 4.Schematic of the pathways analysed in this study. Figure 5. Expression of phosphoprotein markers according to histological subtype demostrates heterogeneity. (cohort 2). Figure 6.K-means clustering of phosphoprotein data (cohort 1 shown here) produces 4 distinct phosphoprotein clusters (A) with different profiles of pathway alteration (B). (C) Overall survival according to phosphoprotein cluster show no differences in prognosis according to phosphoprotein cluster in this cohort of patients.
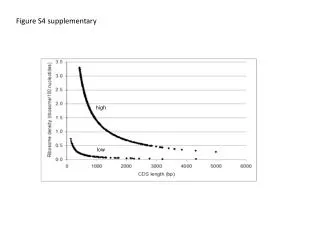
p=0.133 p=0.001 p=0.003 p=0.157 p=0.145 Supplementary Figure 1
A Cluster 1 Cluster 2 B p=0.436 p=0.482 p=0.031 Supplementary Figure 2
Cluster 1 Cluster 2 Supplementary Figure 3
Cadherin RTK JAK RAS b-Catenin RAF TNFR P PI3K PIP3 PIP2 MEK IKKb IKKa AKT IKKg P ERK P STAT3 APOPTOSIS P p65/RelA NFkB p50/52 CELL CYCLE/ PROLIFERATION P ERa P BRCA1 P p53 Histone H2A.X P Supplementary Figure 4 P
Serous Muc Mixed CC Other Endometrioid Supplementary Figure 5
A Cluster 4 Cluster 3 Cluster 1 Cluster 2 B C Supplementary Figure 6