Download
1 / 5

E N D
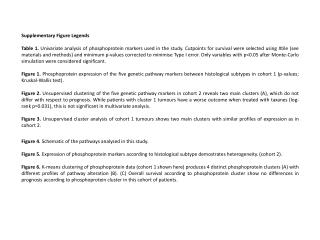
Supplementary Figure Legends Supplementary Figure 1: The variance of pDH activity plotted against mean pDH activity for three populations, obtained from the table published in Zabetian et al (2001). For each population, the blue profile is the genotype-specific variance vs. the mean of pDH activity at rs1611115, the red straight line connects the estimated mean for the high homozygote and the origin and the vertical lines are the 95% confidence intervals for the observed variances on the assumption of normal distributions. Supplementary figure 2:Model-based linkage analysis of pDβH activity on chromosome 19. The red solid-line profile is the multi-point linkage for pDH activity, with Mendelian additive model under logarithm transformation. The blue dotted-line profile is the multi-point linkage for the new trait (after adjusting for 25 SNPs on chromosome 9), with new Mendelian dominant model under logarithm transformation. Supplementary figure 3:Model-free linkage analysis of pDβH activity on chromosome 19. The red solid-line profile is the linkage for pDH activity under logarithm transformation. The blue dotted-line profile is the linkage for the new trait (after adjusting for 25 SNPs on chromosome 9), under logarithm transformation. Supplementary figure 4:Genome-wide model-based linkage of the new trait formed by adjusting for the 25 SNPs, with an additive model under the square-root transformation.