Download
1 / 18
190 likes | 337 Views
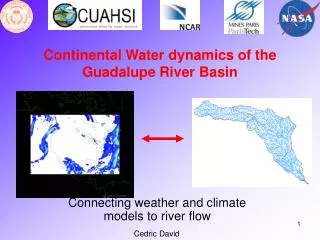
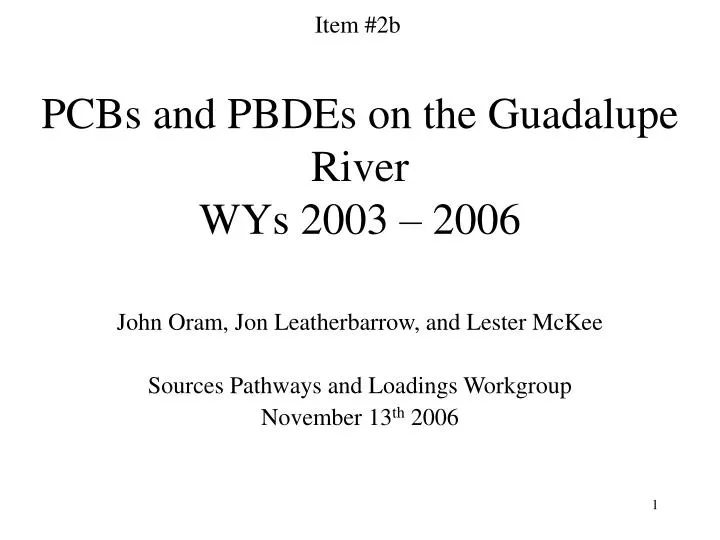
Item #2b. PCBs and PBDEs on the Guadalupe River WYs 2003 – 2006. John Oram, Jon Leatherbarrow, and Lester McKee Sources Pathways and Loadings Workgroup November 13 th 2006. Item #2b. Methods for Estimating Loads of PCBs and PBDEs.

E N D
Item #2b PCBs and PBDEs on the Guadalupe RiverWYs 2003 – 2006 John Oram, Jon Leatherbarrow, and Lester McKee Sources Pathways and Loadings Workgroup November 13th 2006
Item #2b Methods for Estimating Loads of PCBs and PBDEs • Examine relationship between instantaneous SSC and contaminant conc. • Examine spatial/temporal patterns of precip and Q at various locations in watershed to determine source. • Use 1 and 2 to build regression model(s) where appropriate. • Use regression model to estimate 15-minute concentrations. • Use 15-minute Q and 15-minute conc to calculate loads. Iterative Process
Item #2b Sampling Frequency WY 03 (n=21) WY 05 (n=13) WY 04 (n=19) WY 06 (n=14)
Item #2b Sampling Frequency
Item #2b PCBs vs SSC (previous water years) WY 2005
Item #2b PCBs vs SSC WY 2006 • Did not see ‘split’ regression this water year.
Item #2b PBDEs vs SSCWY 2005
Item #2b PBDE Concentrations, Discharge, and Instantaneous SSC
Item #2b PBDEs vs SSCWY 2006 • Attempted to split regression by upper/lower/base flow designations. • Didn’t work this year for PBDEs or PCBs • Two Regressions: • All data • No Outlier
Item #2b Previously Reported Loads
Item #2b WY 2006 Loads
Item #2b Source ID by PCB Homologs? Source activation of ‘new’ PCBs during high flow? Transport of weathered material? From WY05 Report
Item #2b Source ID by PBDE Homologs?
Item #2b How did WY05 and WY06 compare to previous years?
Item #2b How did WY05 and WY06 compare to previous years?
Item #2b April 2006 • 2.21 Kg PBDEs (52% of Seasonal Load) • 30% of 2.21 kg delivered on April 4th = 0.73 kg.
Item #2b Annual Loading Estimates PBDE loads are 3-11x PCB loads. Sources: RMP special study on wastewater discharges; L. McKee; CARB (2005); D. Yee Estimates or Preliminary!
Modeling PBDEs *Predicted inventories are consistent with those estimated from monitoring. Item #2b Model predictions are preliminary. Loads Source: J. Oram, SFEI