Download
1 / 7
70 likes | 209 Views
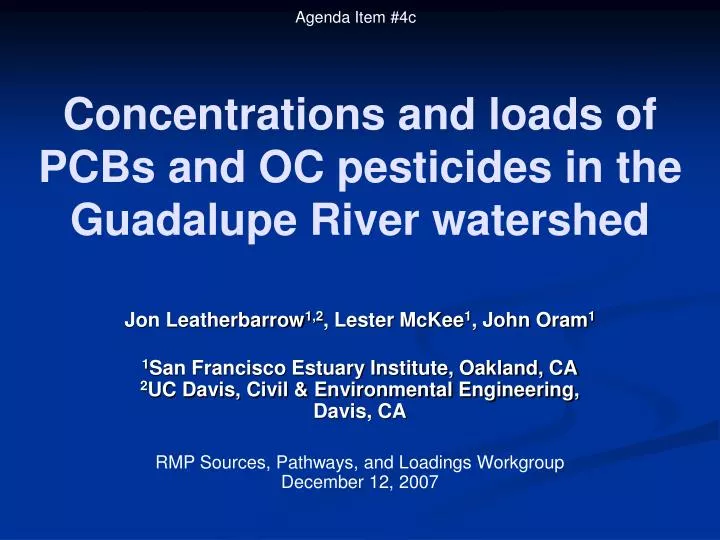
Agenda Item #4c. Concentrations and loads of PCBs and OC pesticides in the Guadalupe River watershed. Jon Leatherbarrow 1,2 , Lester McKee 1 , John Oram 1 1 San Francisco Estuary Institute, Oakland, CA 2 UC Davis, Civil & Environmental Engineering, Davis, CA

E N D
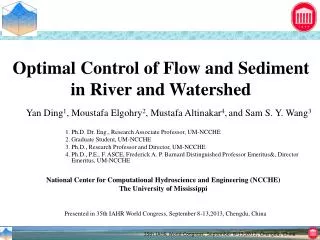
Agenda Item #4c Concentrations and loads of PCBs and OC pesticides in the Guadalupe River watershed Jon Leatherbarrow1,2, Lester McKee1, John Oram1 1San Francisco Estuary Institute, Oakland, CA2UC Davis, Civil & Environmental Engineering, Davis, CA RMP Sources, Pathways, and Loadings WorkgroupDecember 12, 2007
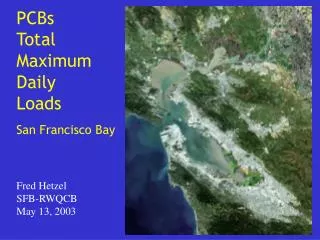
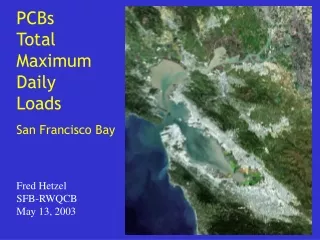
Agenda Item #4c Location
Agenda Item #4c Since last meeting… • Finalized load estimates • Addressed comments from May 2007 SPLWG • Further analyses on potential source activation and watershed processing • Timeline for journal article submission • February 2008: draft article completion • March 2008: internal review and submission • May 2008 SPLWG: update on any response
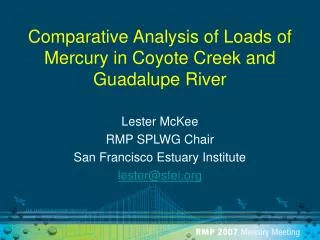
Agenda Item #4c • Annual loads on the order of 0.5 to 1.5 kg per year in Guadalupe River for PCBs, DDT, and Chlordanes; • Extrapolation to other watersheds (by area) suggests that combined loadings from local tributaries (e.g., >10 kg/yr of PCBs) are sufficient to significantly delay recovery from legacy contamination in the Bay. Contaminant loading
Agenda Item #4c • Dispersed non-point sources of legacy contamination by positive relationships between contaminant concentrations and SSC, as opposed to point sources that get diluted by increasing flows and sediment loads; • Urban-to-rural gradient of increasing concentrations from lower to upper watershed hypothesized based on higher concentrations on rising stage of storm events compared to falling stage; • Unique source activation hypothesized based on occurrence of PCB congener profile similar to Aroclor 1016, which varied from commonly observed patterns of Aroclor 1254 and 1260. Potential sources and distribution (hypotheses)
Agenda Item #4c Watershed processing • Congener profiles of multiple-component contaminants (e.g., PCBs, DDT) help infer how mechanisms of source activation and transport differ between low and high flows. • For example, the dominant parent component of technical DDT (p,p’-DDT) comprises ~40% of total DDT concentrations in nearly all samples collected during flows above 20 m3/s indicating the transport of relatively unweathered sediment during high flows. p,p’-DDD ▼ p,p’-DDT ○ Discharge (m3/s)
Agenda Item #4c Further study and information needs • Modeling • Hydrologic routing: where is the water coming from? • Sediment transport: where is the sediment coming from? • Contaminant transport: link evolving contaminant profiles to sources of water and sediment. • Information gathering on other tributaries • Monitoring other selected tributaries • Extrapolation/modeling methods • Evaluate treatment options • Source reconnaissance • Structural treatment selection, design, and placement