Download
1 / 10
120 likes | 603 Views
Tarleton State University January 13, 2010 . Sodexo’s Customer Loyalty Survey Introduction. Greg Nestle, Fall 2009. We use the survey results to improve residential and retail dining services.

E N D
Tarleton State University January 13, 2010 Sodexo’sCustomer Loyalty Survey Introduction Greg Nestle, Fall 2009
We use the survey results to improve residential and retail dining services. The survey results are also used to help us develop new dining plans, retail products and new services. Our goals are to improve resident, non-resident, and faculty/staff satisfaction and loyalty through improved service performance. What are the Benefits of Participating in the Survey?
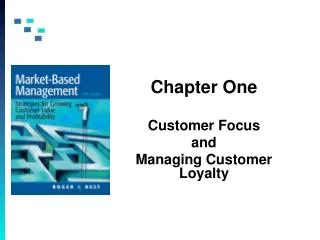
Branded Experience Making it happen Customer Loyalty Still the goal Customer Perceived Value Customer Perceived Quality Customer Satisfaction 1970 1975 1980 1985 1990 1995 2000 2005+ Why do we talk about Loyalty and not Satisfaction?
Customer Loyalty: Defined Customer Loyalty is a behavioralpredisposition on the part of the customer to respond favorably toward the brand/company consistently and across situations. Loyal customers tend to: • Become vocal advocates for your company • Continue using your product/service • Expand their relationship with your company • Comply with requests for feedback/information • Customers become loyal through great customer experiences.
What Customers are Rating in the Survey • Overall Satisfaction with Experience at Dining Location • Dining Atmosphere • Customer Service • Quality of Food • Menu
What the Results Show Customers rate each area via a simple 5-point rating scale: Excellent, Very good, Good, Fair, Poor. The score represents the percentage of respondents rating their satisfaction with a particular location as “Excellent” or “Very good”, the top two responses on the 5-point scale. For example, if a unit has a score of 52% on “Overall Satisfaction”, that translates to: “52% of the customers who responded say their Overall Satisfaction with our service at that particular unit is Excellent or Very Good.”
Customer Survey Results For Tarleton State University in Fall 2009 Overall Satisfaction with Experience at Dining Location Dining Atmosphere Customer Service Quality of Food Menu Additional results for each main category shown above are available in the full report shown at the end of this presentation.
Tarleton State University Performance Against the Key Drivers of Satisfaction Red shows key drivers where performance is below the top quartile—these are our priority areas of improvement. Yellow shows additional areas for improvement. Areas in green show our “strengths” where performance is within the top quartile.