Download
1 / 80
810 likes | 846 Views
15%. SENSE-MAKING . 85%. MAKING SENSE OF THE PAST. The First Birth: Out of Africa. Neanderthal - Homo Sapiens 230,000 - 30,000 - 150,000 - today. Homo Sapiens - The Winners. Almost 7 Billion on planet today Projections between 10 and 14 billion by 2100

E N D
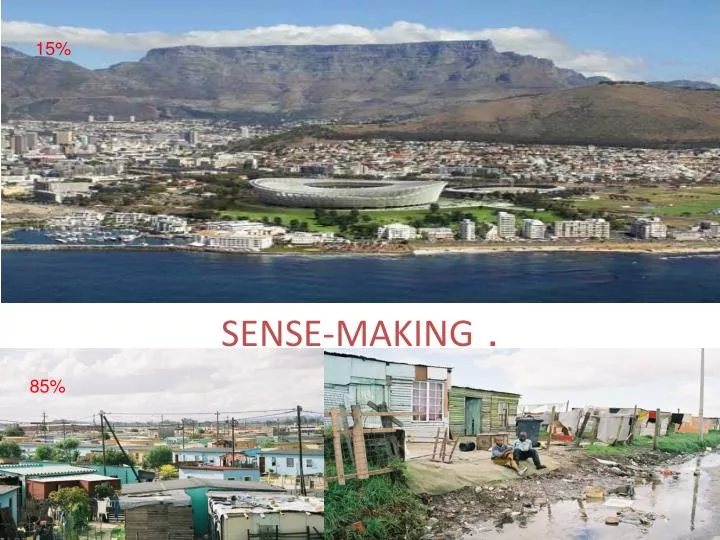
15% SENSE-MAKING . 85%
Neanderthal - Homo Sapiens230,000 - 30,000 - 150,000 - today
Homo Sapiens - The Winners • Almost 7 Billion on planet today • Projections between 10 and 14 billion by 2100 • Bruner says: Homo Sapiens cultural creatures, masters of technology • Creative and ready to adapt to the environment • Neanderthal extinct – could not adapt • Conclusion: No status quo, every species vulnerable • Development not linear
Toba Actually today’s humans originate from a few thousand survivors and we can attribute the cause to the eruption f the super volcano Toba around 73,000 years ago
Ways of Knowing • Science(experimental approach to the physical universe) • Philosophy(the abstract mind) • Rationalism/Scepticism (not accepting realities that are not immediately evident) • Religion (faith in divine revelation and social tradition) Mysticism (experiences based on spiritual techniques) Esotericism(intuitive speculation on cosmological world-views) • Occultism(using psycho-physical techniques to access hidden realities) • Gnosis (innate wisdom and understanding)
What Happened In Africa? • Sahara Desert • North of Sahara incredible cultural challenges • Limited penetration to sub-Saharan Africa • Tribal conflicts • Colonial period: Conquest, Destruction of Kingdoms and Cultures, No new knowledge mission • Apartheid: Expansion of access but low funding • The “Struggle” through schooling: Iconoclasm • By 1994: No strong modern learning culture • At 2010: Still no strong learning culture of any sort
SO WHAT IS THE PROBLEM? We can expect massive future changes, which will change the face of the planet Dr. Susan Solomon http://www.bjerknes.uib.no/pages.asp?id=1416&kat=2&lang=2
Dalin’s 10 Revolutions 1. The knowledge and information revolution 2. The population explosion 3. Globalisation 4. The economic revolution 5. The technological revolution 6. The ecological revolution 7. The social/cultural revolution 8. The aesthetic revolution 9. The political revolution 10. The values revolution. Per Dalin
1994: South Africa’s Triple Challenge • Build a democratic state • Integrate itself into the competitive arena of international production and finance. • Reconstructdomestic social and economic relations to eradicate and redress the inequitable patterns of ownership, wealth and social and economic practices that were shaped by segregation and apartheid • All of this while the entire world is changing dramatically
How Can We Respond? • Thinkers from Imhotep and Confucius through Plato, Aquinas, Ibn Khaldun, Calvin, Newton, Rousseau, Comte, Mill, Marx, Gramsci, Castro, Mao, Nyerere to Wallerstein and Castells in our present day all allocate a special place in their theories of development to knowledge. Education for them is the foundation for whatever form of development or progress one espouses. • Manual Castells: “knowledge and networks”
The Continents: To Scale The land area of each territory is shown here. The total land area of these 200 territories is 13,056 million hectares. Divided up equally that would be 2.1 hectares for each person. A hectare is 100 metres by 100 metres. However, population is not evenly spread: Australia's land area is 21 times bigger than Japan's, but Japan's population is more than six times bigger than Australia's.
Primary Education "Everyone has the right to education", according to the Universal Declaration of Human Rights. The second Millennium Development Goal is to achieve universal primary education. In 2002, 5 out of 6 eligible children were enrolled in primary education worldwide. However, enrolment does not guarantee attendance, or completion. If primary education continues beyond the expected years, enrolment rates can exceed 100%. In Argentina there is an impressive 108% enrolment. On the other side of the Atlantic Ocean 30% of children in Angola are enrolled in primary school.
Secondary Education Worldwide approximately 73 million children are enrolled in each year of secondary education out of a possible 122 million children. That is only 60% getting a secondary education. In China on average 89% get a secondary education, but in India it is only 49%. Figures in Africa are even lower: 45% in Northern Africa, 25% in Southeastern Africa and 13% in Central Africa. The lowest is 5% in Niger. What is compulsory in some territories is a rarity in others.
Tertiary Education The highest percentage of the student aged population enrolled is in Finland. Finland is 3.6 times the world average, with 140 times the chance of a tertiary education than in Mozambique.
Science Research Scientific papers cover physics, biology, chemistry, mathematics, clinical medicine, biomedical research, engineering, technology, and earth and space sciences. The number of scientific papers published by researchers in the United States was more than three times as many as were published by the second highest-publishing population, Japan. There is more scientific research, or publication of results, in richer territories. This locational bias is such that roughly three times more scientific papers per person living there are published in Western Europe, North America, and Japan, than in any other region.
New Patents In 2002, 312 thousand patents were granted around the world. More than a third of these were granted in Japan. Just under a third were granted in the United States. A patent is supposed to protect the ideas and inventions that people have. Patenting something will then allow the owner of the patent to charge others for the usage of an idea or invention. The aim is to reward the creator for their hard work or intelligence. But patents can prevent people from using good ideas because they cannot afford to do so. A quarter of all territories had no new patents in 2002, so will not profit from these in future years as others will.
Books Borrowed This map shows books borrowed from public libraries - which lend books to members for free or for a nominal charge. Libraries share books, making it unnecessary for us to buy books that we will read only once or twice. The most books borrowed were in the Russian Federation. There were high rates of borrowing in Western Europe, Japan and Eastern Europe. In these regions most territories reported some book borrowing. In other regions reported book borrowing was lower, and many territories reported very little borrowing. Where many people cannot afford books, it appears they often cannot borrow them either.
Changes In Life Expectancy In Selected African Countries With High And Low HIV Prevalence: 1950 - 2005 65 60 55 50 Life expectancy (years) 45 40 Senegal 35 30 with high HIV prevalence: Zimbabwe South Africa Botswana with low HIV prevalence: Madagascar Mali 1950– 1955 1955- 1960 1960- 1965 1965- 1970 1970- 1975 1975- 1980 1980- 1985 1985- 1990 1990- 1995 2000- 2005 1995- 2000 Source: UN Department of Economic and Social Affairs (2001) World Population Prospects, the 2000 Revision.
Tuberculosis • The World Health Organisation reports that someone with open tuberculosis would infect 10 to 15 people a year. So when a certain number of people are infected it is very hard to stop it spreading further. Tuberculosis bacilli are spread through the air when someone sneezes or coughs. • In the past 50 years drugs have been developed to treat tuberculosis. The disease has since developed strains that are resistant to those drugs.
HIV Prevalence • This map shows the number of people aged 15-49 years old living with HIV. • In 2003, the highest HIV prevalence was Swaziland, where 38%, or almost 4 in every 10 people aged 15 to 49 years, were HIV positive. • All ten territories with the highest prevalence of HIV are in Central and Southeastern Africa.
Malaria cases • Of all the people living with malaria, 92% live in African territories. Parts of Mediterranean Africa have very low numbers of malaria cases. In contrast, almost half the people living in Uganda suffer from malaria. Uganda also has the most cases of malaria in the world. Most territories are barely visible due to the low number of malaria cases found there.
Sense-makingGHANA-SOUTH KOREA • In 1957, Ghana, then the wealthiest nation in Sub-Saharan Africa, had a per capita income almost equal to that of South Korea (US $490 against US $491 in 1980 dollars). • By the early 1980s, Ghana's annual income per head had fallen by nearly 20 percent to US $400, while South Korea's per capita GDP was, by then, over US $2,000. • The UNDP's 1990 Human Development Report suggests that South Korea had an annual purchasing power per head ten times greater than Ghana ($4,832 vs US $481)
PhDs Per I Million People Post-graduate Profiles Research Profiles
QUANTITATIVE LITERACY NBT Benchmark Levels, February 2009 160 141 140 131 Basic 120 Intermediate Proficient 100 80 60 47 39 35 40 32 20 11 4 4 0 Commerce Law Science UWC
National Benchmark Tests Project:Pilot Test Reports Mathematics Benchmark Levels
Educational Environment Primacy of politics: Legacy of past Curriculum fantasy Rampant anti-intellectualism Schools in crises (80% dysfunctional) Grades 3, 6 and 8 literacy rates two years below benchmarks 50% Dropout rates from Gr 1 – Gr 12 40% Failure rate Gr 12
Educational Environment Last in recent international ratings (55 countries – many in developing world) in High School Maths, Science 50+ % of research currently done by white researchers older than 50 No new generation of scientists
The Lie Unlimited Population Growth Unlimited Resources
The Hope SUSTAINABILITY: Population Resources
The Reality SUSTAINABILITY: Population Resources
2030: A Watershed “By 2030 the demand for resources will create a crisis with dire consequences Demand for food and energy will jump 50% by 2030 and for fresh water by 30%, as the population tops 8.3 billion. Climate change will exacerbate matters in unpredictable ways”. Beddington. “Change is now ubiquitous, non-linear and persistent Hargreaves
So: What Is It All About? Education and The Human Story • “(Wo)man living in a cultural revolution and in a world of war, violence, and social upheaval, is impelled as never before to ask the hard questions of the meaning of historical existence” Robert P Mohan.