Download
1 / 39
390 likes | 397 Views
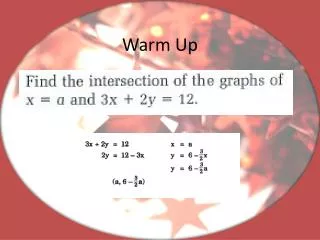
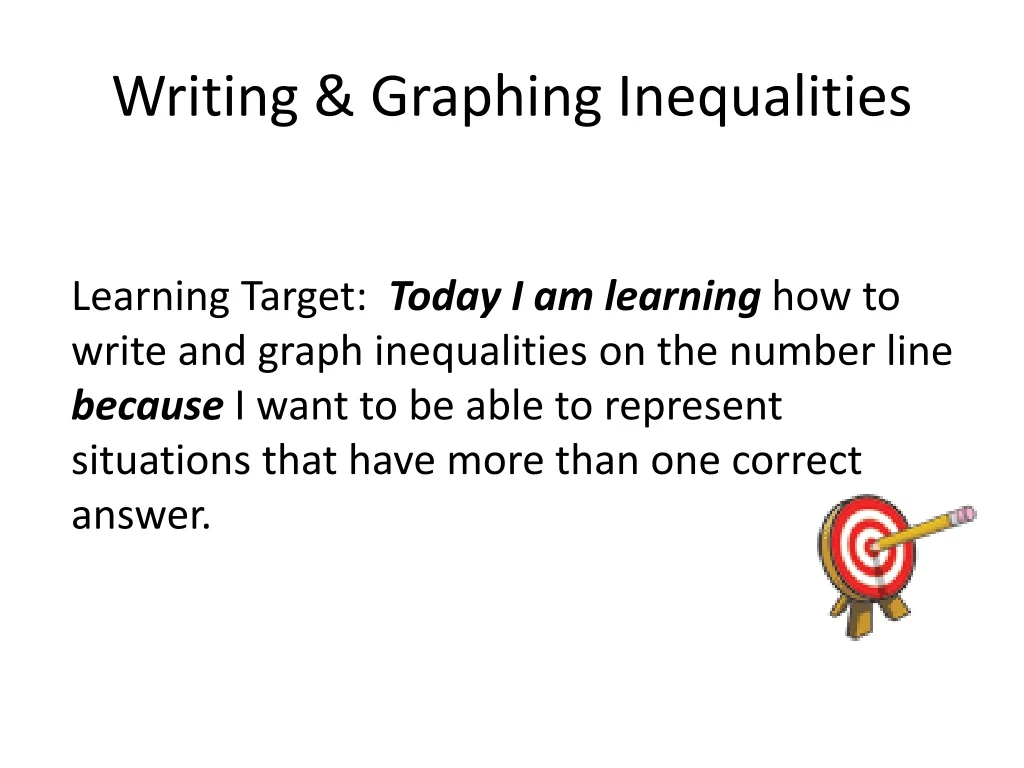
Writing & Graphing Inequalities. Learning Target: Today I am learning how to write and graph inequalities on the number line because I want to be able to represent situations that have more than one correct answer. Where might I see inequalities in real life?.

E N D
Writing & Graphing Inequalities Learning Target: Today I am learning how to write and graph inequalities on the number line because I want to be able to represent situations that have more than one correct answer.
Opening • You are going to Six Flags as soon as school is out (yaay!). You have to be at least 4 ft. tall to ride some of your favorite rides, but it isn’t only 4-foot tall people who can ride the rides! How tall can you be and ride the rides? • See if you can figure out how to represent this with an inequality sign and a variable. (Hint: if it were an equation it would look like this: x = 4 ft. Use one of the inequality symbols posted on the board to make it an inequality.) • What are the possible solutions for x (the variable)? 4 ft. tall and taller x> 4 ft. 4’, 4’1”, 4’2” . . . 6’, 6’1”, etc.! And everything in between!
What are some other situations that have more than one answer or qualifying response? Examples: Scores that qualify for an A: > 90 Money you need to get into Six Flags: > $39 Age required to get the kids’ meal: < 10 years old) Number of days to complete your project < 5 days
Writing and Graphing Inequalities Dr. Burger helps us write inequalities
Inequalities 12-4 Course 2 An inequalitystates that two quantities either are not equal or may not be equal. An inequality uses one of the following symbols: Fewer than, below is less than is greater than More than, above is less than or equal to At most, no more than is greater than or equal to At least, no less than
And: is not equal to Is not equal to
An inequality that contains a variable is an algebraic inequality. A value of the variable that makes the inequality true is a solution of the inequality. An inequality may have more than one solution. Together, all of the solutions are called the solution set.
Write an inequality for each situation. A. There are at least 15 people in the waiting room. “At least” means greater than or equal to. number of people ≥ 15 or x ≥ 15 B. The tram attendant will allow no more than 60 people on the tram. “No more than” means less than or equal to. number of people ≤ 60 or x ≤ 60
Inequalities 12-4 Course 2 Check It Out: Example 1 Write an inequality for each situation. C. There are at most 10 gallons of gas in the tank. “At most” means less than or equal to. gallons of gas ≤ 10 or x ≤ 10 D. There are at least 10 yards of fabric left. “At least” means greater than or equal to. yards of fabric ≥ 10 or x ≥ 10
Write about what you’ve learned: Complete Reading Strategies • Use complete sentences. • Turn it over on your desk when done. It will be collected. • Make sure your name, date, class period are on it!
Graphing Inequalities Words aren’t enough. I want to show an inequality on a number line. Can I do that?? Dr. Burger says yes! We can graph inequalities
Inequalities 12-4 Course 2 You can graph the solutions of an inequality on a number line. If the variable is “greater than” or “less than” a number, then that number is indicated with an open circle. To indicate that solutions include numbers with values less than the point graphed, shade to the left of the point. To show that solutions include numbers greater than the point graphed, shade to the right of the point.
Inequalities 12-4 Course 2 This open circle shows that 5 is not a solution. a > 5 If the variable is “greater than or equal to” or “less than or equal to” a number, that number is indicated with a closed circle. This closed circle shows that 3 is a solution. b ≤ 3
Symbols Review Open Circle Closed Circle The number is included in the solution. • The number is not included in the solution.
Inequalities 12-4 Course 2 Additional Example 2: Graphing Simple Inequalities On your own paper, graph each inequality. A. n < 3 3 is not a solution, so draw an open circle at 3. Shade the line to the left of 3. –2 –1 0 1 2 3 B. a ≥ –4 –4 is a solution, so draw a closed circle at –4. Shade the line to the right of –4. –6 –4 –2 0 2 4 6
Inequalities 12-4 Course 2 Check It Out: Example 2 On your own paper, graph each inequality. A. p ≤ 2 2 is a solution, so draw a closed circle at 2. Shade the line to the left of 2. –3 –2 –1 0 1 2 3 B. e > –2 –2 is not a solution, so draw an open circle at –2. Shade the line to the right of –2. –3 –2 –1 0 1 2 3
Inequalities 12-4 º – 1 2 3 – 0 – 3 2 1 º – 1 2 3 – 0 – 3 2 1 Course 2 Insert Lesson Title Here Lesson Quiz: Part II Graph the inequalities on your own paper. 1.x > –1 2.x < –1
Inequalities 12-4 º – 1 2 3 – 0 – 3 2 1 º – 1 2 3 – 0 – 3 2 1 Course 2 Insert Lesson Title Here Lesson Quiz: Part II Graph the inequalities, continued. 3.x >–1 4.x < –1
Let’s begin by taking the 3 pieces of paper you were given and stacking them with about a 1-2 inch overlap
Now hold the papers together and fold the top down so you have six 1-2 inch flaps, and put two staples at the very top to hold your flip book together.
Copy the following graphs onto each new flap on your flip book as they are shown to you. Make sure that you pay attention whether the circles are open or closed!
Now that we’ve completed the graphs for our flip books, let’s begin writing the inequalities that each graph represents. Make sure that you can write the inequality with the variable both on the right AND the left of the inequality sign. What happens when you switch the side that the inequality is on?
Now go through each graph and fill in the inequalities. When you have finished, check with a partner close to you.
How did you do?! Temperature Check! Give me a thumbs up if you did a great job and didn’t miss any Give me a sideways thumb if you did alright, but you probably need to work on it a little bit Give me a thumbs down if you aren’t getting it yet, and you need some help
Let’s get wordy! Who remembers some key words and phrases that tell us which inequality sign to choose? Raise your hand!
Now we will use these key words to write some word problems for our inequality graphs. Look at the example below to see what I mean…
Let’s finish up by writing word problems for the rest of the graphs. Try to do them on your own, and have your elbow partner check when you’ve finished.