Download
1 / 66
660 likes | 665 Views
An Informatics Framework for the Analysis of Gene Regulation and Pathways. The Computational Biology and Informatics Laboratory. Gene Regulation Tissue specificity Developmental regulation. Stem Cell Development Pancreatic islet cells (hematopoiesis/ erythropoiesis/ others).

E N D
An Informatics Framework for the Analysis of Gene Regulation and Pathways The Computational Biology and Informatics Laboratory
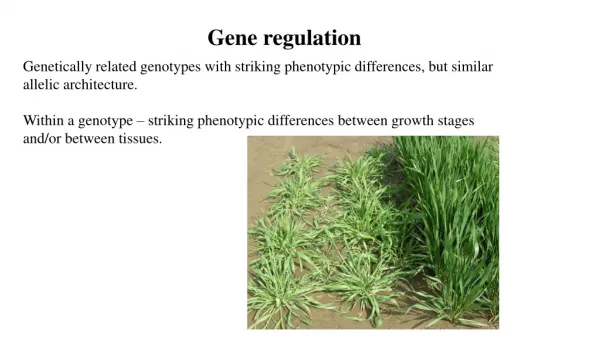
Gene Regulation • Tissue specificity • Developmental regulation • Stem Cell Development • Pancreatic islet cells • (hematopoiesis/ erythropoiesis/ others) • Organismal Biology • Plasmodium falciparum • mouse chromosome 5/neural crest
Examples of Systems Under Study Endoderm Pancreatic anlage PDX-1 p48 Pax4 Exocrine Endocrine
Sequence/ Sequence annotation Pathways/ Networks Gene expression experiment Proteomics, Metabolomics Knowledge Domains
Sequence/ Sequence annotation Pathways/ Networks Gene expression experiment Proteomics, Metabolomics Knowledge Domains
Controlled vocabs. free text • GO • Species • Tissue • Dev. Stage under development GUS: Genomics Unified Schema • Genes, gene models • STSs, repeats, etc • Cross-species analysis Genomic Sequence RAD RNA Abundance DB • Characterize transcripts • RH mapping • Library analysis • Cross-species analysis • DOTS Transcribed Sequence Special Features • Arrays • SAGE • Conditions Transcript Expression • Ownership • Protection • Algorithm • Evidence • Similarity • Versioning • Domains • Function • Structure • Cross-species analysis Protein Sequence Pathways Networks • Representation • Reconstruction
What is GUS ? • A relational schema • Over 180 tables • Organized around central dogma • A Perl API andannotation subsystem • lightweight object layer with “plug-ins” • supports high-level programmatic access but allows SQL • A generic user interface • Java Servlet-based (Apache JServ) • supports browsing and also restricted ad-hoc queries • A data warehouse • GenBank, dbEST, SWISS-PROT, UCSC “Golden Path”, others • Gene Ontology (GO) terms and assignments • Controlled vocabularies: taxonomy, anatomy, disease state • DoTS: database of assembled ESTs and mRNAs
Clusters vs. Contig Assemblies UniGene Transcribed Sequences (DOTS) CAP4: Consensus Sequences -Alternative splicing -Paralogs BLAST: Clusters of ESTs & mRNAs
Mouse Assemblies Over 2 million mouse EST and mRNA sequences used (loaded into GUS as of June 1, 2001) Combined into 367,525 assemblies 71,602 assemblies had more than one sequence 22 sequences on ave./non-singleton assembly 993 nt = ave. length of non-singleton assemblies
Assembly Validation • Alignment to Genomic Sequence via Blast/sim4. • preliminary data look good • Assembly consistency (Assemblies provide potential SNPs)
Sequence/ Sequence annotation Pathways/ Networks Gene expression experiment Proteomics, Metabolomics Knowledge Domains
RAD Multiple labs Multiple biological systems Multiple platforms Expressed genes? Differentially-expressed genes? Co-regulated genes? Gene pathways?
Experiment Raw Data Platform Metadata Processed Data Algorithm RAD: RNA Abundance Database Compliant with the MGED standards
Microarray Gene Expression Database group (MGED) International effort on microarray data standards: • Develop standards for storing and communicating microarray-based gene expression data • defining the minimal information required to ensure reproducibility and verifiability of results and to facilitate data exchange (MIAME, MAGEML-MAGEDOM) • collecting (and where needed creating) controlled vocabularies/ ontologies. • developing standards for data comparison and normalization. http://www.mged.org
Disease Treatment Devel. Stage Anatomy Sample Label ExperimentSample Taxon Exp.ControlGenes Hybridization Conditions ControlGenes Groups ExpGroups RelExperiments Experiment Tables Experiment
Storing the Quantified Data is Just the Beginning Analysis result e.g., cluster # is differentially- expressed Output of image analysis software Normalized data Selected data for analysis SpotResult/ SpotFamilyResult tables Analysis/ Algorithm tables
Different Views of GUS/RAD Focused annotation of specific organisms and biological systems: organisms biological systems Endocrine pancreas Human Mouse CNS GUS GUS Plasmodium falciparum Hematopoiesis *not drawn to scale*
Contig View • OM Restriction Sites • Microsatellites • Self-BLAST • NRDB-BLAST • SAGE Tags • EST/GSS • FullPHAT • GeneFinder • GlimerM • Annotation (chr2-TIGR)
Gene Page - I • Description • Notes • Protein Graphical View • Genomic Neighborhood GV • P. yoelii similarity • NRDB • ProDom
Protein Graphical View • BLASTP • Secondary Structure • Xmembrane • Motifs • Signal Peptides • Hydropathy
The Gabrg1-Gabra2-Gabrb1-Txk-Tec-Gsh2-Pdgfra-Kit-Kdr(Flk1)-Clock BAC contigs on Chr. 5 Sequence available Sequence available
RH Map AV074028 C85052 AV038945 AI507113 AW490897 AI132477 AI848177 Kit AV026557 AV364670 AW987574 AF026073 AF022894 AI586015 C80280 DoTS Assemblies Can Provide A Bridge Between Radiation Hybrid and BAC Contig Maps
Annotation of Mouse BAC Draft Sequence:Localization of the mouse corin gene
Annotation of Kit draft sequence (232h18)Ordering and orienting pieces using conserved regions
Annotation of Kit draft sequence (232h18)Transcription Element Search System analysis • Searched entire human and mouse orthologous sequences with all TESS matrices. • Identified binding sites over/under-represented in the conserved regions. • Conserved sites dispersed over 150kb. • Over-represented factors include AP2, Pax-6, S8, Oct-1, E2A, E2F-DRTF, TAL1-/E47, CdxA, Ubx, AbdB-r, Engrailed, Hairy, DFD
The allgenes (GUS) index provides annotation of array elements in RAD EST clustering and assembly Different representations of the same RNA are identified. EST/mRNA annotations are combined. Consensus sequence is annotated (e.g., gene function).
Creating a “pancreas chip” Top 15% of clone signals in 2 mouse pancreas, 1 human islet, and 1 human insulinoma (GEM) array experiments. AND All the ESTs from 5 islet cDNA libraries. Find mouse and human RNAs in GUS containing these clones/ESTs. If human, BLAST against mouse RNAs to find ortholog. Non-redundant list of mouse RNAs List of mouse IMAGE clone IDs
Identify shared TF binding sites Genomic alignment and comparative Sequence analysis TESS (Transcription Element Search Software) RAD GUS EST clustering and assembly
Common progenitor Exocrine progenitor PDX-1 Endocrine progenitor PDX-1 Ngn3 Beta2 (NeuroD) p48/PTF1 Beta/Delta progenitor Alpha/PP progenitor Beta2 Isl1 Pax6 Nkx2.2 PDX-1 Pax4 Nkx6.1 Brn 4 Pancreatic polypeptide Somatostatin Amylase Glucagon Insulin delta cell exocrine cell alpha cell PP cell beta cell Adapted from: Huang Tsai, J Biomed Sci 2000:7:27-34 and Jensen et al, Diabetes 2000:49 163-176 Example of Systems Under Study: Pancreatic development
CBIL:Chris Overton Chris Stoeckert Vladimir Babenko Brian Brunk Jonathan Crabtree Sharon Diskin Greg Grant Yuri Kondrakhin Georgi Kostov Phil Le Elisabetta Manduchi Joan Mazzarelli Shannon McWeeney Debbie Pinney Angel Pizarro Jonathan Schug PlasmoDB collaborators: David Roos Martin Fraunholz Jesse Kissinger Jules Milgram Ross Koppel, Monash U. Malarial Genome Sequencing Consortium (Sanger Centre, Stanford U., TIGR/NMRC) Allgenes.org collaborators: Ed Uberbacher, ORNL Doug Hyatt, ORNL EPConDB collaborators: Klaus Kaestner Marie Scearce Doug Melton, Harvard Alan Permutt, Wash. U Comparative Sequence Analysis Collaborators: Maja Bucan Shaying Zhao Whitehead/MIT Center for Genome Research Acknowledgements CAP4 provided by Paracel
WWW.CBIL.UPENN.EDU “allgenes” human and mouse gene index: www.allgenes.org PlasmodiumDB: www.plasmodb.org RAD, RNA Abundance Database: www.cbil.upenn.edu/RAD2 Endocrine Pancreas Consortium Database: www.cbil.upenn.edu/EPConDB TESS,Transcription Element Search System www.cbil.upenn.edu/tess PaGE,Patterns from Gene Expression www.cbil.upenn.edu/tess MGED: www.mged.org
Summary • Genomics Unified Schema (GUS) integrates and adds value to genomic, transcribed, and protein sequence. • RNA Abundance Database (RAD) captures experiment, platform, data, and analysis from array and SAGE experiments. RAD adds value through integration with GUS. • System-specific views are available for human and mouse, Plasmodium falciparum, and endocrine pancreas. • GUS and RAD can be used to design custom arrays, identify potential SNPs, genome annotation, and comparative sequence analysis. • Tools such as TESS and PaGE have been developed to analyze the data in GUS and RAD.
EST libraries (wide coverage, low resolution) Ontologies (anatomy, development, disease) Expression patterns Microarrays (high resolution) • Expression rules • TFBS (promoter analysis) • Protein domains (splice forms)
Ontologies in Gene Expression Databases • Controlled vocabulary (ontologies not always needed) • hierarchical • Directed acyclic graphs • Schema • Concepts as objects or relational tables • Attributes and data types provide specification • Relationships specified through subclassing (objects) or foreign keys (relational tables) • Knowledge representation • Link to other domains (gene sequence annotation, gene and protein roles, pathways) • Facilitate data exchange by mapping common concepts
GUS Object View Gene Gene Feature Genomic Sequence NA Sequence RNA RNA Feature RNA Sequence Protein Protein Feature Protein Sequence AA Sequence
High Level Flow Diagram of GUS Annotation Genomic Sequence mRNA/EST Sequence BLAST/SIM4 ORNL Gene predictions GRAIL/GenScan Clustering and Assembly Predicted Genes DOTS consensus Sequences Merge Genes Gene/RNA cluster assignment Gene Index Gene families, Orthologs Assign Gene Name, Manual Annotation.. Predicted RNAs Predicted Proteins Grail/Genscan, DIANA/framefinder BLASTX PFAM,SignalP, TMPred, ProDom, etc BLASTP Algorithms for functional predictions BLAST Similarities Protein Features/Motifs GO Functions CellRoles