Download
1 / 15
160 likes | 280 Views
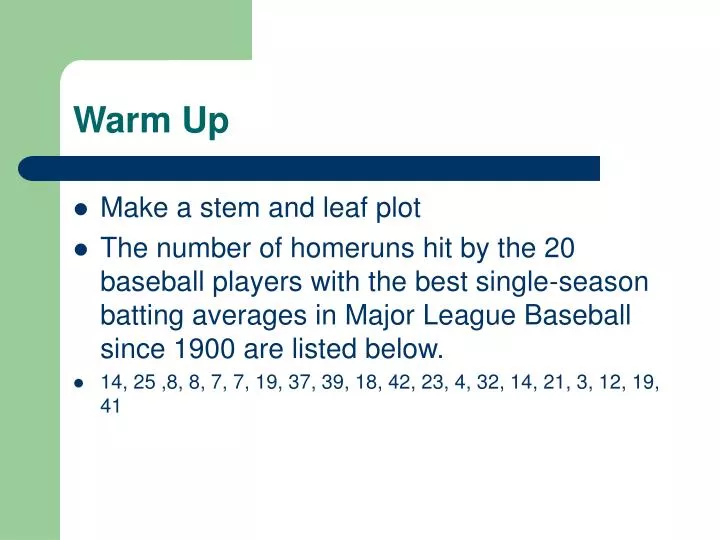
Warm Up. Make a stem and leaf plot The number of homeruns hit by the 20 baseball players with the best single-season batting averages in Major League Baseball since 1900 are listed below. 14, 25 ,8, 8, 7, 7, 19, 37, 39, 18, 42, 23, 4, 32, 14, 21, 3, 12, 19, 41. Answer. Homeruns

E N D
Warm Up • Make a stem and leaf plot • The number of homeruns hit by the 20 baseball players with the best single-season batting averages in Major League Baseball since 1900 are listed below. • 14, 25 ,8, 8, 7, 7, 19, 37, 39, 18, 42, 23, 4, 32, 14, 21, 3, 12, 19, 41
Answer • Homeruns • Stem Leaves • 0 3 4 7 7 8 8 • 1 2 4 4 8 9 9 • 2 1 3 5 • 3 2 7 9 • 4 1 2 Key 1 4 = 14 homeruns
4.6 Box Plots A Box and Whisker Plot –organizes data values into four groups. The ordered data are divided into lower and upper halves by the median. The median of the lower half is the lower quartile. The median of the upper half is the upper quartile. Think of quarters: football, 4 quarters to a dollar……4 parts!
Steps to constructing a Box Plot • Step 1: Order the data • Step 2: Draw a number line to match data. • Step 3: Find the median of the data. • Step 4: Find the lower and upper quartiles • (Finding the median of lower half and upper half of data)
More steps….. • Step 5: Plot the median, the quartiles, the maximum and the minimum. • Step 6: Draw box from lower quartile to upper quartile. Draw vertical line through the median. Draw line segment from box to maximum and from box to minimum.
Here is an example of how to construct • Ex. 1: Data: 10, 1,7, 5, 1, 8, 5, 4, 6, 5, 9, 12 Step 1: Order 1, 1, 4, 5, 5, 5, 6, 7, 8, 9,10,12 Step 2: Draw number line: 1 3 5 7 9 11 Step 3 Find the median: 5.5 Step 4 Find the lower and upper quartiles LQ 4.5 UQ 8.5
Continued:: • Step 5: Draw Box around LQ and UQ, with vertical line running through Median. 9 11 1 3 5 7 Step 6: Draw line from UQ to max and LQ to min.
5 Number Summary Box plot gives us a 5 number summary: Minimum Maximum Median Lower Quartile Upper Quartile 1 12 5.5 4.5 8.5 For the example prior we have:
Give it a try: • Data: 5, 7, 8, 3, 12, 15, 9, 11, 15 2 3 4 5 6 7 8 9 10 11 12 13 14 15 16 17 5 number summary Min=3, Max 15, LQ=6, UQ 13.5, Median 9 Interquartile range: 13.5 -6 = 7.5
What can we find from the 5 number summary? • Range • Quartiles • Median • Interquartile range—UQ –LQ • Are there outliers?
How to read the plot • 25% of data falls below the LQ • 25% of data is above the UQ • 50% of data falls in the interquartile range • You can compare data using Box and Whisker plots….
What are outliers? • A value that is widely separated from the rest of the data in a data set is called an outlier. • Typically a data value is considered an outlier when it is greater than the UQ by more than 1.5 times the interquartile range or if it is less than the LQ by more than 1.5 times the interquartile range.
Example of how to look for Outlier • From example prior slide. • 5 number summary • Min=3, Max 15, LQ=6, UQ 13.5, Median 9 • Interquartile range: 13.5 -6 = 7.5 • An outlier would be any data that is 1.5(7.5)=11.25 more than UQ of 13.5. To be an outlier on high end….>24.75 • An outlier on low end would be 1.5(7.5)=11.25 less than LQ which is 6. An outlier on that end would be -5.25 There are no outliers.
Outliers • To find outliers…find interquartile range • Multiply interquartile range by 1.5. • Add this number to UQ. Subtract from LQ • Any number outside these answers is an outlier. • It is the data that is way out of whack with other data….so check….something might have made this data invalid…..ie..super low test score…..maybe this student has been out ill for 2 weeks prior to test.
Homework: • Worksheet 4.6 Box Plots