Download
1 / 25
250 likes | 394 Views
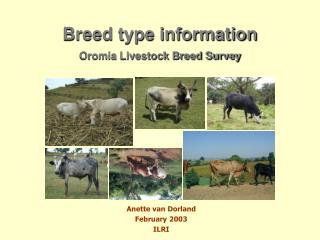
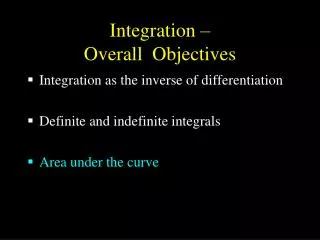
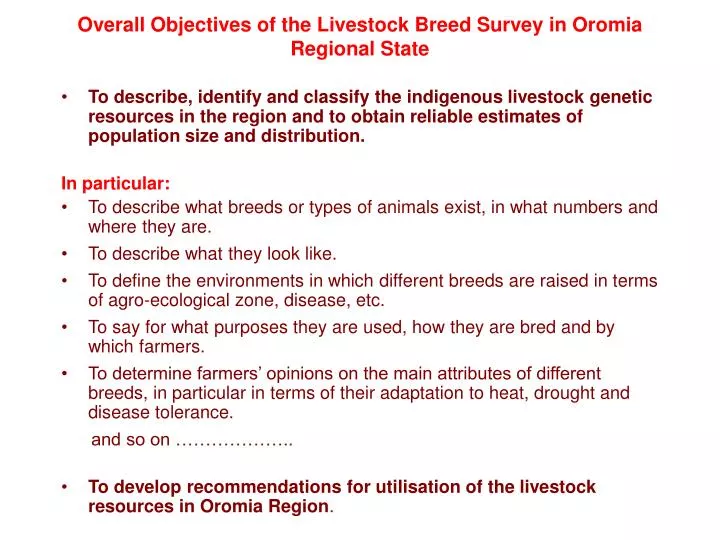
Overall Objectives of the Livestock Breed Survey in Oromia Regional State. To describe, identify and classify the indigenous livestock genetic resources in the region and to obtain reliable estimates of population size and distribution. In particular:

E N D
Overall Objectives of the Livestock Breed Survey in Oromia Regional State • To describe, identify and classify the indigenous livestock genetic resources in the region and to obtain reliable estimates of population size and distribution. In particular: • To describe what breeds or types of animals exist, in what numbers and where they are. • To describe what they look like. • To define the environments in which different breeds are raised in terms of agro-ecological zone, disease, etc. • To say for what purposes they are used, how they are bred and by which farmers. • To determine farmers’ opinions on the main attributes of different breeds, in particular in terms of their adaptation to heat, drought and disease tolerance. and so on ……………….. • To develop recommendations for utilisation of the livestock resources in Oromia Region.
Not an easy task! Such a survey requires careful planning to ensure that these objectives can be met. At least 6 months should be set aside for planning a survey in a region. This includes: • seeking cooperation of partners • agreeing on objectives for the survey • planning how the survey will be executed and by whom • finding out what ancillary (census) statistics may be available on household numbers, people and livestock. • organising a sampling frame • selecting zones, woredas and peasant associations to sample • organising for training of supervisors and enumerators • making sure that everyone is clear on final arrangements • planning for data entry and analysis and making arrangements with those to be responsible ………… and so on.
Types of sampling cluster representative stratified convenience random purposive
Cluster Sampling • When sampling a large area it is easier in terms of survey costs and survey administration for the area to be first divided into clusters. • To do so use can be made of the administrative structure in a country. • In Ethiopia this is region zone woreda peasant association. Sampling units can be selected at each administrative layer in turn.
Zone Woreda Peasant Association Cluster sampling
Stratified sampling • The sampling units within a given administrative layer may vary in relation to a particular characteristic, e.g. agro-ecological zone, livestock density and household size. • A completely random sample may miss woredas from a certain agro-ecological zone or a particular livestock density. It may also not adequately represent the population of households in a village. • By efficiently stratifying according to agro-ecological zone, livestock density or household size a more precise estimate of the number of livestock in a population can be achieved.
Stratified sampling Strata Units selected
Sampling frame DefinitionThe entire list of zones, woredas, peasant associations (P.A.) and households in a region. • How large should a survey be and how many zones, woredas, P.A.s and households should be sampled? • This depends on funds available, costs of organising the survey, available manpower, administrative support, means of transport and ease of access to villages. • Proportionally more units should be sampled at the upper than the lower layers. In the survey in Oromia Region all zones, approximately 30% of woredas, 17% of P.A.s per woreda and 4% of households per P.A. were sampled. • This meant that approximately 1 in 500 households were sampled in Oromia Region.
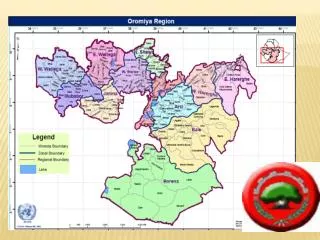
All 12 zones of Oromia were included in survey Oromia Zone Survey design and sampling frame • The Oromia Region covers a third of Ethiopia
Woreda Peasant Association Household Survey design and sampling frame (cont.) Stratification by: • agro-ecological zone • livestock density • Stratification by: • agro-ecological zone • Stratification by: • numbers of livestock • types of species
Survey design and sampling frame (cont.) • Sampling • About 30% of woredas in each zone sampled. Selected woredas (55 in total) • About 17% of P.A.s in each selected woreda sampled. • Thirty households sampled within each selected PA. • About 0.2%of all households (5558) sampled in the region.
Stratification and selection of woredas in East Wellaga Zone by agro - ecological zone and livestock density. Sorted by livestock density Sorted by agr o - ecological zone Woreda Livestock Livestock Woreda Agro - ecological zone (%) 2 per km density Name No. Name No. Woinadega Kolla Dega Abe Dongoro 2 13 low Sasiga 14 0 100 0 Sasiga 14 14 low Abe D ongoro 2 0 0 100 Wama Boneya 16 22 low Jimma Horro 11 0 0 100 Ebantu 6 25 low Jimma Arjo 10 33 33 33 Limu 12 35 medium Sibu Sire 15 33 33 33 Amuru Jarte 3 35 medium Wama Boneya 16 38 47 15 Nunu Kumba 13 50 mediu m Abay Chomen 1 50 50 0 Gidda Kiremu 7 52 medium Ebantu 6 50 50 0 Jimma Arjo 10 71 high Limu 12 50 40 0 Guduru 8 72 high Bila Sayo 4 50 0 50 Diga Leka 5 73 high Diga Leka 5 50 0 50 Guto Wayu 9 73 high Jimma Rare 17 50 0 50 Sibu Sire 15 74 high Amuru Jarte 3 100 0 0 Bila Sayo 4 76 high Gidda Kiremu 7 100 0 0 Abay Chomen 1 84 high Gudure 8 100 0 0 Jimma Horro 11 181 very high Guto Wayu 9 100 0 0 Jimma Rare 17 241 very high Nunu Kumba 13 100 0 0
Dega Woinadega Kolla Agro - ecological zone very high high low high medium Livestock density low 1 1 1 3 1 Numbers of woredas 2 1 1 Selected for sampling Agro - ecological Dega/Woinadega Dega/Woinadega/Ko lla Woinadega/Kolla zone very high high high high low Livestock density medium 2 Numbers of woredas 1 1 1 2 1 1 1 Selected for sampling 1 Selection of woredas of East Wellega by agro - ecological zone and livestock dens ity
Selection of woredas in East Wellaga zoneSummary • Five woredas selected, one from each of Dega, Dega/Woinadega, Dega/Woinadega/Kolla, Woinadega and Woinadega/Kolla zones. • One woreda selected from areas of very high (>180), two from areas of high (70-85) and two from areas of medium livestock density (35-55 livestock per km2). • Representative sampling used to ensure balance in selection of woredas across agro-ecological zone and livestock density strata. • No element of randomisation.
Selection of P.A.s • In woredas covering different agro-ecological zones ( e.g. Woinadega/Dega) P.A.s were randomly sampled from within each agro-ecological zone. • In woredas situated entirely with one agro-ecological zone P.A.s were randomly selected from all P.A.s in the woreda.
Selection of households • Households selected as far as possible at random to ensure coverage of households with low, medium and high numbers of livestock. • Ten households selected in turn for cattle, sheep and goats as the primary species. • All households in each sampled P.A. subsequently categorised into low, medium and high numbers of livestock for each species in turn in order to facilitate estimation of the total numbers of cattle, sheep and goats in the P.A.
Sample selection of households by size category for cattleHaro P.A. in Limu Woreda a Approximately proportional to stratum size but with extra households in more variable ‘high’ group.
Methods of sampling (1) Random sampling • Samples drawn completely at random, each with an equal chance of being selected. • This method generally applied in selection of households in a P.A. • This method also used to select P.A.s from selected woredas stratified by agro-ecological zone. • Only method that allows unbiased estimation of population numbers.
Methods of sampling (2) • Representative sampling • Samples selected to be representative of population. • This method applied at the zone layer. • Method makes the estimation of overall population numbers in the zone more difficult unless additional ancillary data are available.
Methods of sampling (3) Convenience sampling • Samples selected to allow, for example, ease of access to a P.A. or household, or to make best use of available manpower. • Occasional use inevitable in such a survey. • Document when method used. • Provided such cases are few, probably reasonable to assume randomness for the purpose of estimation of population numbers.
Methods of sampling (4) • Purposive sampling • Sampling based, for example, on knowledge of known farming system or known breed unique to a certain location. • Document when method used so that suitability of sample for inclusion in calculation of population estimates can be judged.
Summary A few recommendations for successful survey design and implementation in Ethiopia. • Ensure sufficient replication at the upper administrative layers to allow efficient estimates of population numbers and breed distributions to be determined. • But match this requirement with knowledge of available manpower, resources (transport, etc), adequacy of infrastructure (administration, roads, etc), quality of field staff and size of budget.
Summary (continued) • Determine what region / zone / woreda / P.A. statistics are already available on numbers of households, people or livestock that may help to improve the efficiency of sample selection and population estimation. • Use this information to define appropriate strata for the sampling frame. • Ensure that selections of sampling units at the woreda, P.A. and household levels at least are as far as possible at random. • Above all, obtain high quality data from a manageable sample of • households.