Download
1 / 29
290 likes | 448 Views
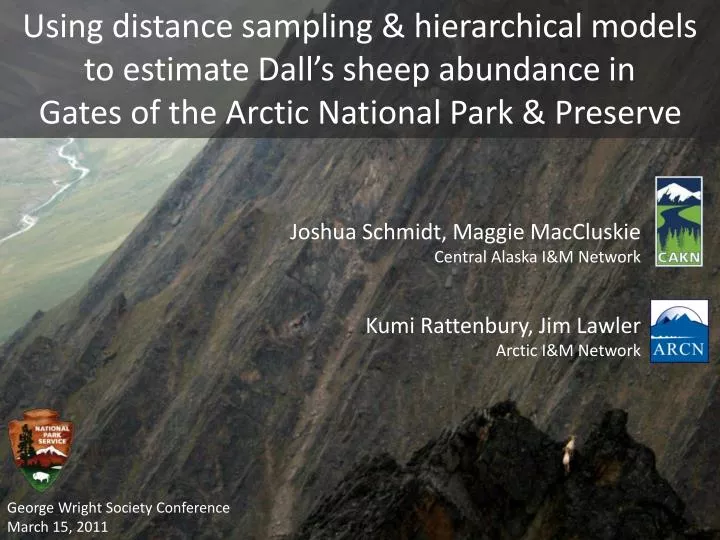
Using distance sampling & hierarchical models to estimate Dall’s sheep abundance in Gates of the Arctic National Park & Preserve. Joshua Schmidt, Maggie MacCluskie Central Alaska I&M Network Kumi Rattenbury, Jim Lawler Arctic I&M Network. George Wright Society Conference March 15, 2011.

E N D
Using distance sampling & hierarchical models to estimate Dall’s sheep abundance in Gates of the Arctic National Park & Preserve Joshua Schmidt, Maggie MacCluskie Central Alaska I&M Network Kumi Rattenbury, Jim Lawler Arctic I&M Network George Wright Society Conference March 15, 2011
Arctic Network (ARCN) Gates of the Arctic NP&Pres (GAAR) Noatak National Preserve Kobuk Valley National Park Cape Krusenstern N Monument Bering Land Bridge N Pres ~8,000-12,000 sheep Dall’s sheep (Ovis dalli dalli) >20,000 sheep 30-40% of world-wide population Lake Clark NP&Pres ~800 sheep Central Alaska Network (CAKN) Denali National Park and Preserve Wrangell-St. Elias National Park & Preserve Yukon-Charley Rivers N Preserve
Monitoring Objectives Trends in abundance and distribution Changes in sex and age composition Changes in habitat, forage and harvest ~27,000 km2 sheep habitat in GAAR GAAR Fairbanks ~27,000 km2 sheep habitat in WRST WRST Anchorage
1982-84 Minimum count (Singer 1984) 1987 Minimum count (Adams 1988) 1996 Double sampling (Whitten 1997, Brubaker and Whitten 1998) 1998-02 Minimum count, radio-collars (Lawler 2004) 2005-07 Stratified random sampling (Rattenbury and Lawler 2010) 2005, 08 Minimum count (Rattenbury and Lawler 2010) GAAR Sheep Surveys, 1982-2008 Gates of the Arctic National Park and Preserve Anaktuvuk Pass
Previous Survey Methods minimum count, double sampling, stratified random sampling • Detection • Detection ≠ 1 • May change through time • Different pilots/observers • Weather conditions • Group size, behavior, location • Habitat • Logistics • Total coverage not realistic • Time intensive • Weather limited • Sheep movement • Inference • High annual variability • Inconsistent coverage • Limited comparability • No/biased estimates of uncertainty Itkillik Preserve, GAAR Anaktuvuk Pass
Distance Sampling Basic form • Traverse a transect • Identify individuals or groups of interest • Record perpendicular distance from line • Detection probability decreases with distance Burnham et al. 1980, Buckland et al. 2001, 2004
Distance Sampling: Theory Theoretical data • Equal numbers exist at each distance from the line Observed data • Observed numbers decline with distance from the line Detection Function • Estimates shape of decline Buckland et al. 2001
Distance Sampling: Theory Main Assumptions • All groups on the line are detected • Groups are detected at their initial location • Perpendicular distance measurements are accurate • Detections are independent Buckland et al. 2001
Distance Sampling: Mountainous Terrain • Contour Transects • Follow at 300’ AGL • Search uphill side • Mark groups with GPS • Route/data recorded on laptop • Similar to Becker-style bear surveys • (Quang & Becker 1999, Becker & Quang 2009, Walsh et al. 2010) • Pilot/observer act as a team
Distance Sampling in GAAR • June 23-30 & July 22-25, 2009 • 5 planes (170 hours flight time) • 308 of 316 transects • 166 groups, X = 4.4 sheep/group • 31,452 km2 survey area • July 5-14, 2010 • 5 planes (110 hours flight time) • 318 of 321 transects • 217 groups, X = 2.5 sheep/group • 26,921 km2 survey area
Analysis: Spatially-explicit Bayesian modeling Royle et al. 2004, Royle and Dorazio 2008, Johnson et al. 2010
Analysis Steps ArcMap 9.3 • Calculate strip width (w) • Calculate area sampled (ai) • 3. Select detection function Program Distance 6.0 Bayesian framework WinBUGS 1.4 Abundance estimates
1. Strip Width (w) • Use 2009 and 2010 observed distances • Right truncation: remove largest 5% of observed distances • Left truncation: 22m blind area below plane, uphill side (Walsh et al. 2010) w = 663 m (a) (b) (c)
3. Detection Function • Program Distance 6.0 • Fit models to 2009 and 2010 data • Use AIC to select detection function Hazard-rate model Half-normal model • x = distance from line • σ = scale parameter • b = shape parameter (Thomas et al. 2009, 2010; Burnham and Anderson 2002)
3. Detection Function 1.2 Histogram: 2009 and 2010 GAAR data Bars = observed distances of groups from transect line Solid line = hazard-rate detection function (∆AIC = 3.9) 1.0 0.8 Detection Probability 0.6 0.4 0.2 0.0 0 200 300 400 500 600 100 Perpendicular Distance in Meters
4. Detection Probability: Covariates • Bayesian Framework • Covariate effects onscale parameter of detection function (σ) • Year 2009 v 2010 • Weather, Turbulence, Group Activity (2010 only) • Pilot-observer team – confounded with density βyear = year-specific intercept Covariates
5. Probability of Presence 1.2 • Estimate # unobserved groups using data-augmentation • (Royle and Dorazio 2008) • Group abundance per transect 1.0 0.8 Detection Probability 0.6 0.4 0.2 0.0 0 200 300 400 500 600 100 Perpendicular Distance in Meters
5. Probability of Presence on Transect i • Distribution and Density Effects • Year (γyear) • Elevation (Ei) • Elevation2 • Conditionally autocorrelated random effect (CAR; ei) • Parametersγi ,γ2 logit(Ψi) = (γyear +γi Ei+γ2 Ei2 + ei)
6. Estimated Group Size ) ) Detection depends on group size, distance from transect Regress observed group size against detection function ĝ(y) to estimate mean group size (Buckland et al. 2001) Ê(sij) = exp (αyear+ αdist1 + eij) Ê(sij) = expected group size for transect i, group j αyear = year-specific intercept αdist1 = slope of the regression of sij on ĝ(y) eij = normally distributed random effect
2009 and 2010 Abundance Estimates WinBUGS1.4, program R 2.9.0 means, 95% credible intervals Σ { [Proportion lambs for observed group sizes nyear]* [Ê(sij)] }i ΣNi ΣNi Σ [Di * ai] Σ [Di * ai] – = = NItkillik Ntotal Nadults Nlambs = = = = [(Σai) / Atotal] [(Σai) / AItkillik] [(Σai) / Atotal] [(Σai) / AItkillik] [(Σai) / Atotal] Ntotal Nlambs Ni= Transect abundance Ni= Transect density ai= Sample area/transect Ê(sij) = Expected group size for transect i, group j A= Survey area
Dall’s sheep abundance: GAAR Adults Lambs Total 13.5% CV 12% CV 1982-84* 2005-06 # 2007# 2010 2009 *1982-84 aerial census (Singer 1984); no estimates of precision, accuracy, detection. # 2005-2007 stratified random sampling surveys analyzed per Gasaway et al. (1986); no estimate of detection. Error bars = 95% CI; 95% Bayesian credible intervals in 2009 and 2010.
Itkillik Preserve 2,542 km2 Minimum counts Distance sampling # Sheep 1983 1996 2005 2008 2009 2010 Survey year
Itkillik Preserve 2,542 km2 Flight time cost, 2010 prices Minimum counts Distance sampling $17,000 # Sheep $10,290 $10,080 $8,600 19 hrs helicopter 37 hrs 48 hrs 11 hrs 15 hrs 49 hrs 77% survey area $3,150 $2,310 1983 1996 2005 2008 2009 2010 Survey year
Distance Sampling: WRST Wrangell-St. Elias National Park and Preserve • July 19-27, 2010 • 4 planes (70 hours flight time) • 129/315 transects in northern WRST • > 200 groups, X = 4.4 sheep/group • 26,850 km2 survey area • Southern WRST - 2011 CANADA ALASKA Sheep per group 1-5 6-13 14-28 Transects Surveyed in 2010 Eliminated (ice) Not surveyed Survey area NPS boundary
Bayesian Framework Create combined sheep model for NPS Alaska • Use all data for detection • Estimate abundance for sex/age classes, covariates • Unbiased local estimates (e.g., < 2,500km2) • Improved precision: 30% reduction in CV More efficient surveys and data analysis • 70-80% reduction in survey cost • Reduced risk to employees • Higher completion rate
Other Applications in Alaska Muskox (Ovibos moschatus) in Bering Land Bridge NPres, Cape Krusenstern NM, Noatak NPres Bears (Ursus spp.) in Southwest Alaska (Walker et al. 2010) Mountain goats (Oreamnos americanus) in Wrangell-St. Elias, Kenai Fjords, Glacier Bay, SE Alaska
Thanks to . . . Pilots: Andy Greenblatt, Sandy Hamilton, Eric Sieh, Lance Williams, Ken Barnes, Marty Webb, Jerry Lee Observers: StaciaBackensto, Christy Splechter, Tara Whitesell, Judy Putera, Laura Phillips Logistical support: Paul Atkinson, Scott Miller, Doris Lenahan, Kate Schaefer; NPS staff in Anaktuvuk Pass, Coldfoot, Bettles, Gulkana, Copper Center, McCarthy, Slana, DENA ArcMap/ArcPadtools: Bill Thompson,Cuyler Smith, Buck Mangipane; GeoNorth LLC Laura Phillips, Brad Shults Jay VerHoef, Johann Walker
Questions? Joshua_Schmidt@nps.gov 907-455-0661 Kumi_Rattenbury@nps.gov 907-455-0673