Download
1 / 56
2.6k likes | 7.26k Views
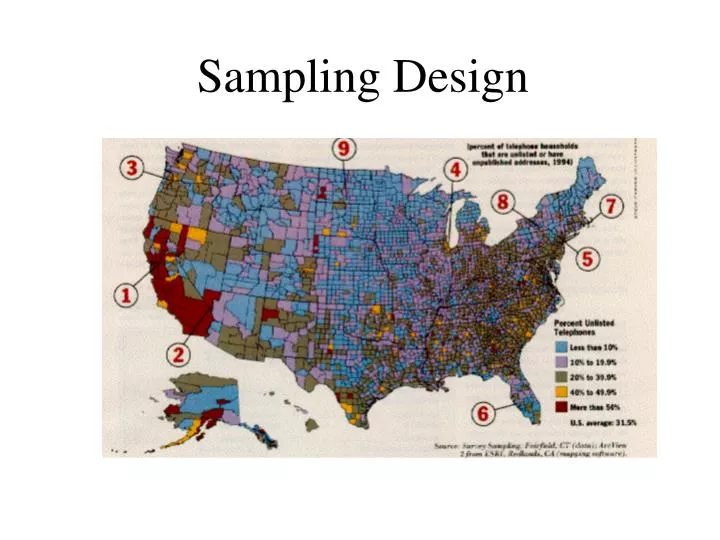
Sampling Design. Steps in Sampling Process. 1. Define the population 2. Identify the sampling frame 3. Select a sampling design 4. Determine the sample size 5. Draw the sample. Sampling Design Process. Define Population. Determine Sampling Frame. Determine Sampling Procedure.

E N D
Steps in Sampling Process 1. Define the population 2. Identify the sampling frame 3. Select a sampling design 4. Determine the sample size 5. Draw the sample
Sampling Design Process Define Population Determine Sampling Frame Determine Sampling Procedure Non-Probability Sampling Type of Procedure Convenience Judgmental Quota Probability Sampling Type of Procedure Simple Random Sampling Stratified Sampling Cluster Sampling Determine Appropriate Sample Size Execute Sampling Design
Terminology • Population • The entire body of units of interest to decision makers in a situation. • Element (sampling unit) • one unit from a population • Sampling • The selection of a subset of the population • Sampling Frame • Listing of population from which a sample is chosen Census • A polling of the entire population Survey • A polling of the sample
SAMPLING • Census -- the entire population • most useful is the population ("n") is small • or the cost of making an error are high • Sample -- contacting a portion of the population (e.g., 10% or 25%) • best with a very large population (n) • easiest with a homogeneous population
Terminology • Parameter • The variable of interest • Statistic • The information obtained from the sample about the parameter • Goal • To be able to make inferences about the population parameter from knowledge of the relevant statistic - to draw general conclusions about the entire body of units • Critical Assumption • The sample chosen is representative of the population
Population Vs. Sample Population of Interest Population Sample Parameter Statistic Sample We measure the sample using statistics in order to draw inferences about the population and its parameters.
Characteristics of Good Samples • Representative • Accessible • Low cost
…this (bad)… Population Sample
…or this (VERY bad)… Sample Population
Define the Population • It addresses the question “Ideally, who do you want to survey?” • It involves • defining population units • setting population boundaries
Steps in the Sampling Process 1. Define the “population” The Element ...... individuals families seminar groups sampling Unit…. individuals over 20 families with 2 kids seminar groups at ”new” uni Extent ............ individuals who have bought “one” families who eat fast food seminar groups doing MR Timing .......... bought over the last seven days
The Target population for a toy store can be defined as all households with children living in Calgary. What’s wrong with this definition?
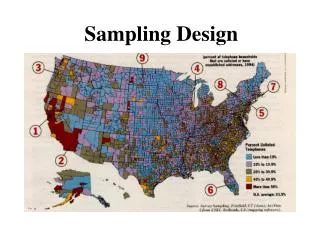
Sampling Frame • Obtaining a “list” of population (how to reach sample) Students eat at Maconalds? young people at random in the street? ‘phone book students union listing Uni. mailing list • Problems with lists • omissions • ineligibles • duplications • Random digit dialing (RDD)
Select “sample units” • Individuals • Household • Streets • Telephone numbers • Companies
Selecting a Sampling Design • Probability sampling • simple random sampling • systematic sampling • stratified sampling • cluster sampling • Non-probability sampling • convenience sampling • judgement sampling • snowball sampling • quota sampling
Probability Sampling • An objective procedure in which the probability of selection is nonzero and is known in advance for each population unit. • It is also called random sampling.
Simple Random Sampling (SRS) • Population members are selected directly from the sampling frame • Equal probability of selection for every member • Use random number table or random number generator
Simple Random Sampling N = the number of cases in the sampling frame n = the number of cases in the sample NCn = the number of combinations (subsets) of n from N f = n/N = the sampling fraction
Objective: To select n units out of N such that each NCn has an equal chance of being selected Procedure: Use a table of random numbers, a computer random number generator, or a mechanical device to select the sample
Systematic Sampling • Order all units in the sampling frame based on some variable and number them from 1 to N • Choose a random starting place from 1 to N and then sample every k units after that
systematic random sample number the units in the population from 1 to N decide on the n (sample size) that you want or need k = N/n = the interval size randomly select an integer between 1 to k then take every kth unit
Stratified Sampling (I) • The chosen sample is forced to contain units from each of the segments, or strata, of the population • Steps: • Population is divided into strata based on an appropriate population characteristic. • Simple random samples are then drawn from each stratum.
Stratified Sampling (II) • Direct Proportional Stratified Sampling • The sample size in each segment is proportional to the segment size in the population • Disproportional Stratified Sampling • The sample size in each segment is NOT proportional to the segment size in the population • Used if 1) some segments are too small 2) some segments are more important than others 3) some segments are more diversified than others
Cluster Sampling • Clusters of population units are selected at random and then all or some randomly chosen units in the selected clusters are studied. • Steps: • Population is divided into subgroups, or clusters. Ideally, each cluster adequately represents the population. • A simple random sample of a few clusters is selected. • All or some randomly chosen units in the selected clusters are studied.
cluster or area random sampling divide population into clusters (usually along geographic boundaries) randomly sample clusters measure all units within sampled clusters
When to use stratified sampling • If primary research objective is to compare groups • Using stratified sampling may reduce sampling errors When to use cluster sampling • If there are substantial fixed costs associated with each data collection location • When there is a list of clusters but not of individual population members
Non-Probability Sampling • Subjective procedure in which the probability of selection for some population units are zero or unknown before drawing the sample.
Types of Non-Probability Sampling (I) • Convenience Sampling • A researcher's convenience forms the basis for selecting a sample. • Judgement Sampling • A researcher exerts some effort in selecting a sample that seems to be most appropriate for the study.
Types of Non-Probability Sampling (II) • Snowball Sampling • Selection of additional respondents is based on referrals from the initial respondents. • Used to sample from low incidence or rare populations. • Quota Sampling • The population is divided into cells on the basis of relevant control characteristics. • A quota of sample units is established for each cell. • A convenience sample is drawn for each cell until the quota is met. (similar to stratified sampling)
Quota Sampling Let us assume you wanted to interview tourists coming to a community to study their activities and spending. Based on national research you know that 60% come for vacation/pleasure, 20% are VFR (visiting friends and relatives), 15% come for business and 5% for conventions and meetings. You also know that 80% come from within the province. 10% from other parts of Canada, and 10% are international. A total of 500 tourists are to be intercepted at major tourist spots (attractions, events, hotels, convention centre, etc.), as you would in a convenience sample . The number of interviews could therefore be determined based on the proportion a given characteristic represents in the population. For instance, once 300 pleasure travellers have been interviewed, this category would no longer be pursued, and only those who state that one of the other purposes was their reason for coming would be interviewed until these quotas were filled.
Probability Vs. Non-Probability Sampling • Non-probability sampling is less time consuming and less expensive. • Theoretically speaking, quantitative generalizations about population can only be done under probability sampling. • However, in practice, marketing researchers also apply statistics to study non-probability samples.
The sampling process 1. Determine the target population who are the people you want information on? age, gender, product use 2. Determine the sampling frame how will you get the names, phone numbers or addresses? • existing lists, phone book, random digit dialing
The sampling process 3. Select a sampling procedure: A. Probability (random) sample • equal chance of being included in the sample • random number table, even-odd, etc. B. Stratified • equalizing "important" variables • year in school, geographic area, product use, etc.
The sampling process C. Nonprobability sampling • convenience sample • people in my classes • "snowball" sample • friends of friends • "quota" sampling • 50 women, 50 men • mall intercepts • Market Mall
Generalization • You can only generalize to the population from which you sampled • U of L students not college students • geographic, different majors, different jobs, etc. • College students not Canadian population • younger, poorer, etc. • Canadians not people everywhere • less traditional, more affluent, etc.
Drawing inferences from samples • Population estimates • % who smoke, buy your product, etc • 25% of sample • what % of population? • very dangerous with a non-representative sample or with low response rates
Drawing inferences from samples • Relationships • e.g., exposure to ads and liking for the product • relationships (qualitatively different) • less dangerous with a non-representative sample
Errors in Survey Sampling Error • random error • the level of it is controlled by sample size • a larger sample size leads to a smaller sampling error. Non-sampling Error • systematic Error • the level of it is NOT controlled by sample size.
Non-Sampling Errors (I) • The basic types of non-sampling error • Non-response error • Response or data error • A non-responseerror occurs when units selected as part of the sampling procedure do not respond in whole or in part • If non-respondents are not different from those that did respond, there is no non-response error
Non-Sampling Errors (II) • A response or data error is any systematic bias that occurs during data collection, analysis or interpretation • Respondent error (e.g., lying, forgetting, etc.) • Interviewer bias • Recording errors • Poorly designed questionnaires
Determine sample size • IsSizeEverything? • Typical Statistics estimate requires: • Population variance • Acceptable sample error • Level of confidence (coefficient of confidence)
Sample Confidence “Probability” we can take results as “accurate representation” of universe (i.e. that “sample statistics” are generalisable to the real “population parameters”) Typically a 95% probability (i.e. 19 times out of 20 we would expect results in this range)
Example: We can be 95% sure that, say, 65% of a target market will name Martini’s “V2” vodka in an unprompted recall test plus or minus 4%
We can be 95% sure (level ofconfidence) that, say, 65%(predicted result) of a target market (of a given total population) will name Martini’s “V2” vodka in an unprompted recall test plus or minus 4% (to a known margin of error)
95% confidence If we do the same test 20 times then it is statistically probable that the results will fall between 61-69 %, at least 19 times If we lower the probability then we lower the sample error e.g.. at a 90% confidence level, result might be believe between 64% - 66% (a tighter range but we are less sure the sample is representative of the real population)
Sample Size Issues • Accuracy • Resources / Budget • Time • Reachability • Statistical Analysis • Sub Group Size
Cost of research sample size cost