Download
1 / 42
440 likes | 610 Views
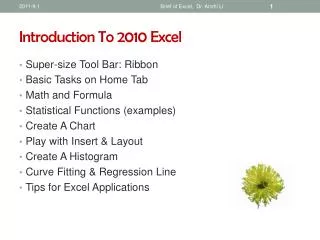
Introduction to Excel 2010. CTC S ummer Workshop June 13, 2012 9:00a.m. - 4:00p.m. Instructor Janet Cannon. Agenda. Start at 9:00a.m. Introductions Discussion – what you know/want to know Breaks ≈ 10:30 & 2:30 Lunch from 12:00-1:00 Learn basic vocab and navigation.

E N D
IntroductiontoExcel 2010 CTC Summer Workshop June 13, 2012 9:00a.m. - 4:00p.m. Instructor Janet Cannon
Agenda • Start at 9:00a.m. • Introductions • Discussion – what you know/want to know • Breaks ≈ 10:30 & 2:30 • Lunch from 12:00-1:00 • Learn basic vocaband navigation • Learn and practice basic commands • Learn and practice basic functions • Answer questions, requests for Excel II • Evaluations • Finish at 4:00p.m.
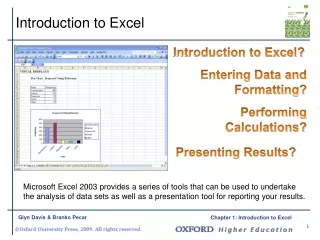
I. What are the main differences between MS Excel 2007 and 2010? • No more “Office button” Instead, you have a color coded “File” tab that gives you the same options as the Office Button. • More options when it comes to customizing the look of your screen/spreadsheet. http://office.microsoft.com/en-us/excel-help/what-s-new-in-excel-2010-HA010369709.aspx
II. What are spreadsheets and how do they work? • A spreadsheet is an electronic version of paper ledgers • Spreadsheets are divided into rows (numbered), columns (lettered), and cells (number and letter coordinate) • Spreadsheet data is typed in as labels (text), constants/values (numbers), and functions (calculations) • Spreadsheets are divided into worksheets (individual pages), workbooks (file)
II. What are spreadsheets and how do they work? • Navigation • Enter – down a row • Tab – right one column • Shift + Tab –left one column • Arrow keys – up, down, left, right • Ctrl + Home – beginning of document • Ctrl + End – end of document • Type coordinate/name in Name box (Activities for you to do/try will be in RED)
Open Excel. Use keyboard to navigate the sheet. Use the name box to go to a particular cell. Type in a label (text). Type in a constant/value (number).
III. Key features of MS Excel 2010 • File tab– new, open, save, print • New to create a new file. • Open to access a previously created file. DON’T go to save or save as to open your files! • Save as-you’re saving the document for the first time OR you want to re-save it as a different name or in a different place. • Save – Save changes you’ve made to a previously saved file. • Note – if you click “save” when working with a new file, it will automatically go to the “save as” screen.
Use the File Tab to create a new file. Click Save As. Type in a file name for your work. Save your work to the Desktop. Close Excel. Open your work.
III. Key features of MS Excel 2010 • Top of Window • Quick Access toolbar (drop down arrow)Defaults to Save, Undo, and Redo – can use keyboard commands CTRL + S (save), CTRL + Z (undo) and CTRL + Y (redo) • Document name/format – shows the name of your current document, status of document (if applicable) and what format/program you are working in.
III. Key features of MS Excel 2010 • Window commands – controls how you see screen • Minimize–reduces screen to bottom toolbar • Restore down/Maximize – shrinks from full screen to a re-sizable screen • Close – closes file (prompts to save if not saved)
Type something into Excel. Undo it. Redo it. Use the Window commands to Minimize, then maximize your screen
III. Key features of MS Excel 2010 • Ribbon – tabs and command blocks • Tabs – Home, Insert, Page Layout, Formulas, Data, Review, View • Command Blocks – (to view additional commands in each block, click the small arrow in lower right corner of each box)
Click and hold the ALT button to see keyboard commands on the ribbon. Double click the tabs to minimize the Ribbon, double click again to reveal. Hold mouse over command to see button name and short description.
III. Key features of MS Excel 2010 • Ribbon minimize/expand arrow– toggles between Ribbon or Tabs only • Help button – Blue circle with white question mark in upper right corner • Either click this button or F1 to access help function • Type in search term(s) • Click the article you think is most helpful. You can click back if it does not give you the information you want. Search for information on “bullets.”
III. Key features of MS Excel 2010 • Excel window commands – similar to Windows commands but with Excel files only. • Function button – displays dialog box to help you type or edit your formula • Formula box/expand formula box – view entire contents of cell.
Type in a series of numbers in a column. Put your cursor in the blank cell underneath. Click the Function button. Type in “sum” (no quotation marks). Click “Go” then “Okay” two times. (Excel should display the sum of the numbers you typed in.) Click Function button to view formula in cell.
III. Key features of MS Excel 2010 • Select all – box between A and 1, selects all cells • Scroll bars – scrolls up and down, left and right of information in file (only works for length/width of typed data) • Sheet navigation buttons – arrows go to first sheet, back one, forward one, end sheet Click Select all. Click sheet navigation buttons.
III. Key features of MS Excel 2010 • Sheet tabs – displays name of each sheet available, gives options to copy, move, or create new sheets • Mode indicator – Ready, Edit, Enter • Macro record indicator – shows when a macro is being recorded (a pre-determined set of steps you use frequently) Create a new sheet or two. Move/Rename them.
III. Key features of MS Excel 2010 • Quick stats bar –displays basic stats on highlighted numbers, CTRL + right click to see basic stats on select numbers • Quick view buttons - Normal, Page Layout, Page Break Preview Type some numbers. Click and drag to select. View stats. Change views.
III. Key features of MS Excel 2010 • Zoom slide – use plus or minus/slide to increase or decrease zoom level. Doesn’t change print size! Change zoom percent with slider or with – and +. You can also use CTRL plus the scroll on your mouse to zoom in/out.
Let’s use Excel! Click on a clean sheet. Start in cell A1. Type in the data for ice cream flavors. You decide how to arrange it.
IV. Navigating MS Excel 2010 • Note: Word is word processing. Excel is data entry – They respond differently. • Typed entry does not “leak” into other boxes, but does look like it. Click in an overlapping box and check the Formula Bar. • MUST click in initial box to edit. Click on initial box and check Formula Bar. • You can type/edit within the cell OR use the formula bar. Edit one of your entries.
IV. Navigating MS Excel 2010 • Selecting Items • Select All – choose every cell on the sheet • Select column – click on letter at top for one column, click and drag across for multiple columns • Select row – click on number at side for one row, click and drag up or down for multiple rows • Select cells – click and drag over the cells you wish to select
IV. Navigating MS Excel 2010 • Changing size of rows or columns • Select the rows or columns you wish to alter • Move the cursor to the line dividing two rows or columns (you’ll see a double sided arrow with a line in the center) • Click and drag to the size you want OR go to HOME tab, Format, then change the row/column to size you want
IV. Navigating MS Excel 2010 • Inserting/deleting rows or columns –right click on row/column reference, insert or delete command • Moving cell information – Click and drag over information to be moved, move cursor to edge (see a four-sided arrow), click and drag to new location. Can also use Copy/Cut and Paste commands • Basic Calculations without functions - use standard operation symbols +, -, *, /, ( )
V. Ribbon Commands • Change the font style and size of your titles. • Change the font color of your totals. • Select one column and fill it with a light color. • Center the row of titles. • Insert a row at the top, type in a title, merge and center it across your table.
V. Ribbon Commands • Select your numbers. Change the Number Format to Number. • Use Auto Sum to calculate your total. • Add a column called “Percentages.” Use operations to figure the percentage of each item. • Sort A-Z by name. Filter by a number (you choose)
V. Ribbon Commands • Insert at least 2 pictures from clip art • Insert at least 2 shapes • Insert Smart Art • Highlight your table and insert a chart or graph
V. Ribbon Commands • Insert a hyperlink • Insert a text box • Insert Word Art • Insert a signature line • Insert a symbol
V. Ribbon Commands • Change the margins to 0.5 on all sides • Change orientation to Landscape • Add a background color/texture/picture
V. Ribbon Commands • Select a few columns/rows, use the ribbon to change • Width • Height • Change scale to 95% • Change settings for Gridlines, Headings • Select a picture and change position/orientation
V. Ribbon Commands • Explore each function category. Choose one or two you’d like to try and write them down. • Use Insert Function to add the following information to your table: Min, Max, Average, Count
V. Ribbon Commands • Click Sheet 2 (or a new sheet) • Type in the information for “Goals Met for the Year” • Sort the information as you choose. • Filter out all the “no”s • Use font changes, highlighting/fills, borders etc. to format your table.
V. Ribbon Commands • Check your spelling • Click Track Changes • Change your table (add rows/columns, change data) • Add at least 2 comments • Use Previous and Next to switch between comments • Delete the comments
V. Ribbon Commands • Change to different views. • In Page Break Preview, change the print area by moving the solid blue lines • Show/hide features that are hidden/shown • Zoom in/out with the ribbon
Type in the information for • “Money Earned from Sales in 2011. • Arrange it in a way that the data is accurately represented and makes sense to your eyes.
VI. Basics of Functions • Function format – type the “=” sign then the function command (no space between) then type the open parenthesis, add your constants or cell references, then close parenthesis. Example: =sum(A1*A2) • Sum – adds numbers or range of numbers • Average – displays the average of a range of numbers • Min– displays the minimum number of a range of numbers • Max– displays the maximum number of a range of numbers • Count– displays the number of numbers in a range of numbers
VII. Formatting Tables/Charts • Manually type in the functions for each person’s total. • Add the functions for Average, Min, Max, and Count. • Use the font/border/color tools to format your table. • Highlight the information and create a chart/graph.
VII. Formatting Tables/Charts • Add Labels to your chart: Click the chart to select it, then click on the LAYOUT tab (won’t show up unless you click the chart!) • Add Chart Title, Axis Titles, change the Legend labels by clicking the appropriate button and adding the information.
VIII. Other features, options, or items of note • Templates – Office button, New, then choose one • When saving a document you’re going to share with others, make sure to choose a format everyone can access. For example, Office 2007 .xlsx files cannot be opened by a previous version without a downloaded add-on.
Practice • Go to • http://www.abacustraining.biz/Exercises/Excel/ BasicSSConcepts.htm • And • http://www.abacustraining.biz/Exercises/Excel/ BasicChartCreation.htm • To practice creating tables and charts. • If possible, use copy and paste to insert the data.
Questions? • Something else you’d like to know how to do? • Anything unclear? • What would you like to see in Excel II? • Please fill out an evaluation/leave it in folder. I do not read these, so please be honest. • Thank you for your time. I hope you learned something that will help you use Excel more efficiently. • More questions?: cannonj@capetigers.com Thank you!