Download
1 / 11
120 likes | 325 Views
ON SOME GRAPH RELATED PROBLEMS IN TRANSPORTATION ANALYSIS. Jaume Barceló, Mª Paz Linares, Oriol Serch jaume.barcelo@upc.edu , mari.paz.linares@upc.edu , oriol.serch@upc.edu Department of Statistics and Operations Research inLabFIB UNIVERSITAT POLITÈCNICA DE CATALUNYA-BARCELONA TECH.

E N D
ON SOME GRAPH RELATED PROBLEMS IN TRANSPORTATION ANALYSIS Jaume Barceló, Mª Paz Linares, Oriol Serch jaume.barcelo@upc.edu, mari.paz.linares@upc.edu, oriol.serch@upc.edu Department of Statistics and OperationsResearch inLabFIB UNIVERSITAT POLITÈCNICA DE CATALUNYA-BARCELONA TECH
THE PROBLEM Efficient Data Processing leads to accurate, high added value, reliable information Efficient Data Gathering (Technology) + Efficient Data Processing (Computational Models) Smartness DATA INFORMATION HOW MANY? / WHERE? PURPOSE? • CITY: Transport Infrastructure + Sensor Network: • Static (Loop, AVI, CCTV, …) • Mobile: persons, vehicles • CITY: • Active Traffic Management • Advanced Mobile Services 2nd Workshop on Graph-Based Technologies and Applications
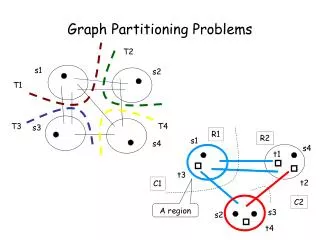
EXAMPLES OF SENSOR LOCATION A) Sensors in streets Magnetometres detect all vehicles coming from (1), (3) and (4), but not the ones coming from (2) y (5) B) Sensorsonintersections The Bluetooth/Wifi sensor (red circle) and its detection lobule (yellow area) intercepts part of the vehicles following all routes C) Optimum: Hybridlayout – sensorsboth in streets and intersections 2nd Workshop on Graph-Based Technologies and Applications
GENERATE THE CITY’S BASIC MODEL: COMPLETE GRAPH OF THE TRANSPORT NETWORK QUALITY ANALYSIS OF THE LAYOUT IN RELATION TO THE SENSORIZATION’S OBJECTIVES FORMULATING THE SOLUTION • PLAUSIBLE PATHS IDENTIFICATION • PATH FLOW IDENTIFICATION BASE OF LOCATION ALGORITHMS ACCORDING TO MODEL HEURISTIC SOLUTIONS LOCATION MODELS (DEPENDING ON CRITERIA) FOR SENSOR DEPLOYMENT SPECIFIC CRITERIA FOR SENSOR DEPLOYMENT PARTIAL PATHS CAN BE RECONSTRUCTED FROM THE POSITION OF THE SENSORS DIRECT GENERATION OF TRAVEL TIMES WITH BLUETOOTH SENSORS 2nd Workshop on Graph-Based Technologies and Applications
EACH LAYOUT PROPOSAL REQUIRES AN ADEQUATE MODEL LOCATING TRAFFIC SENSORS AT LINKS Model for the maximization of the overall flow and intercepted OD pairs for the location in sections LINK COVERING OPTIMIZATION PROBLEM IN THE UNDERLYING GRAPH LOCATING TRAFFIC SENSORS AT INTERSECTIONS NODE COVERING OPTIMIZATION PROBLEM ON GRAPHS 2nd Workshop on Graph-Based Technologies and Applications
COMPARATIVE RESULTS OF THE EXACT AND HEURISTIC SOLUTIONS WITH ADDITIONAL CONSTRAINTS FOR THREE NETWORKS (Preston, UK, Barcelona, ES, Hessen, D) Preston: 417 links, 166 nodes, 34 Centroids Barcelona: 1570 links, 692 nodes, 210 Centroids Hessen: 4282 links, 495 nodes, 245 Centroids 2nd Workshop on Graph-Based Technologies and Applications
EXAMPLE FOR THE LOCATION OF BLUETOOTH SENSORS IN INTERSECTIONS Percentage of the overall quantity of intercepted vehicles as a function of the number and location of the sensors Optimum location of 50 sensors at Barcelona’s Ensancheneighborhood and the main intercepted routes 2nd Workshop on Graph-Based Technologies and Applications
DEALING WITH TIME-DEPENDENT TRAVEL TIMES IN TRANPORTATION NETWORKS: FINDING THE MOST LIKELY USED PATHS • di = departure time fromclienti • si = sevice time forclienti • Tij(di) = travel time fromitojwhendeparting at time difromclienti • Tij(di)Tij(di’) 2nd Workshop on Graph-Based Technologies and Applications
DECREASING ORDER OF TIME (DOT) (Chabini 1998) • DOT solves the all-to-one shortest path for all departure times. • Assumptions: • FIFO property on each link of the road network. • After certain time horizon T, all arc costs remain constant. • Backwards procedure starting with calculation of static shortest paths at time T. Algorithm Notation • Initialization • Fori = 1 ton do: • Fort = 0 toT do: • C[i][t] • N[i][t] Fort = 0 toT do: • C[q][t] 0 • Compute staticshortestpathsfort = T • 2. Mainloop: • Fort = T – 1 downto 0 do: • For (i,j) A do: • t* = min{ T, t + dij(t) } • ifC[i][t] > C[j][t*] + dij(t) then: • C[i][t] C[j][t*] + dij(t) • N[i][t] j q = destinationnode n = number of nodesonthenetwork dij(t) = travel time betweennodesi and jwhendeparture time ist, t {0,1,…,T} Cit = Cost of optimalpathfromnodeitonodeqwhendeparture time fromiist. Nit = Nextnodeontheoptimalpathfromnodeitonodeqdeparting at time t. 2nd Workshop on Graph-Based Technologies and Applications
TIME-DEPENDENT SP’S: IMPLEMENTATION ISSUES • Example: • Matrix C: stores the cost of traveling from node i to destination node q when departure time is j, • node i is determined by the row index and time period j is determined by the column index. • Let’s assume a network with 2000 nodes and 500 time periods • Matrix C 1 million entries 4 megabytes. • Problem: 2000 C-matrices in memory 7.5 Gb RAM 2nd Workshop on Graph-Based Technologies and Applications
TIME-DEPENDENT SPS: YALE SPARSE MATRIX FORMAT Example of Matrix C: aij = cost of traveling from node i to node q at time instant j IA(i) = position of column in array JA of node i JA(i) = corresponding position of column in matrix C of node I (time departure) Reduction of 60% in memory requirements A(i) = travel time from node (i) to destination when departure time is JA(i) 2nd Workshop on Graph-Based Technologies and Applications