Download
1 / 22
220 likes | 237 Views
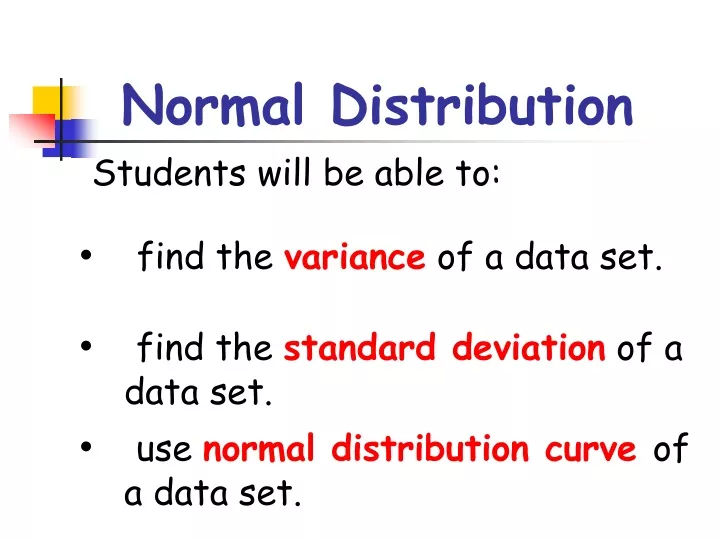
Normal Distribution. Students will be able to: find the variance of a data set. find the standard deviation of a data set . use normal distribution curve of a data set. Variance.

E N D
Normal Distribution • Students will be able to: • find the variance of a data set. • find the standard deviation of a data set. • use normal distribution curve of a data set.
Variance Variance is the average squared deviation from the mean of a set of data. It is used to find the standard deviation.
Variance Steps 1. Find the mean of the data. • Subtract the mean from each value. 3. Square each deviation of the mean. 4. Find the sum of the squares. 5. Divide the total by the number of items.
Sigma Notation, , which represents the sum of all. Variance Formula Mean is represented by n is the number of items.
notation: lowercase Greek letter, sigma. Standard Deviation Standard Deviation Take the Square root of the Variance. If the data is close together, the standard deviation will be small. If the data is spread out, the standard deviation will be large.
The bell curve which represents a normal distribution of data shows what standard deviation represents. One standard deviation away from the mean ( ) in either direction on the horizontal axis accounts for around 68 percent of the data. Two standard deviations away from the mean accounts for roughly 95 percent of the data with three standard deviations representing about 99 percent of the data.
Standard Deviation Formula Notice the standard deviation formula is the square root of the variance.
Find the variance and standard deviation The math test scores of five students are: 92,88,80,68 and 52. 1) Find the mean: (92+88+80+68+52)/5 = 76. 2) Subtract the mean from each data. 92-76=16 88-76=12 80-76=4 68-76= -8 52-76= -24
4) Find the sum of the squares 256+144+16+64+576= 1056 5) Divide by the number of data 1056/5 = 211.2 This is the VARIANCE.
6) Find the square root of the variance: The standard deviation of the test scores is 14.53.
The standard deviation of the test scores is 14.53. What was the mean?
Try it out! A different math class took the same test with these five test scores: 92,92,92,52,52. Find the standard deviation for this class and Bell Curve.
Hint: • Find the mean of the data. • Subtract the mean from each value – called the deviation from the mean. • Square each deviation of the mean. • Find the sum of the squares. • Divide the total by the number of items – result is the variance. • Take the square root of the variance – result is the standard deviation.
Answer Now Solve: A different math class took the same test with these five test scores: 92,92,92,52,52. Find the standard deviation for this class.
The math test scores of five students are: 92,92,92,52 and 52. 1) Find the mean: (92+92+92+52+52)/5 = 76 2) Find the deviation from the mean: 92-76=16 92-76=16 92-76=16 52-76= -24 52-76= -24 3) Square the deviation from the mean: 4) Find the sum of the squares: 256+256+256+576+576= 1920
6) Find the square root of the variance: The math test scores of five students are: 92,92,92,52 and 52. 5) Divide the sum of the squares by the number of items : 1920/5 = 384 variance Thus the standard deviation of the second set of test scores is 19.6.
Answer Now Analyzing the data: Consider both sets of scores. Both classes have the same mean, 76. However, each class does not have the same scores. Thus we use the standard deviation to show the variation in the scores. With a standard variation of 14.53 for the first class and 19.6 for the second class, what does this tell us?
Analyzing the data: Class A: 92,88,80,68,52 Class B: 92,92,92,52,52 With a standard variation of 14.53 for the first class and 19.6 for the second class, the scores from the second class would be more spread out than the scores in the second class.
Answer Now Analyzing the data: Class A: 92,88,80,68,52 Class B: 92,92,92,52,52 Class C: 77,76,76,76,75 Estimate the standard deviation for Class C. a) Standard deviation will be less than 14.53. b) Standard deviation will be greater than 19.6. c) Standard deviation will be between 14.53 and 19.6. d) Can not make an estimate of the standard deviation.
Analyzing the data: Class A: 92,88,80,68,52 Class B: 92,92,92,52,52 Class C: 77,76,76,76,75 Estimate the standard deviation for Class C. a) Standard deviation will be less than 14.53. b) Standard deviation will be greater than 19.6. c) Standard deviation will be between 14.53 and 19.6 d) Can not make an estimate if the standard deviation. Answer: A The scores in class C have the same mean of 76 as the other two classes. However, the scores in Class C are all much closer to the mean than the other classes so the standard deviation will be smaller than for the other classes.
Summary: As we have seen, standard deviation measures the dispersion of data. The greater the value of the standard deviation, the further the data tend to be dispersed from the mean.