Download
1 / 55
550 likes | 669 Views
Climate Change Mitigation Bruce A. McCarl Department of Agricultural Economics Texas A&M University. Discussion Outline. Why Might We Mitigate? Brief History of the UNFCCC The KYOTO Protocol and its Mechanisms U.S. Cost of Compliance with KYOTO protocol

E N D
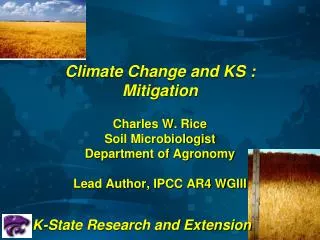
Climate Change Mitigation Bruce A. McCarl Department of Agricultural EconomicsTexas A&M University
Discussion Outline • Why Might We Mitigate? • Brief History of the UNFCCC • The KYOTO Protocol and its Mechanisms • U.S. Cost of Compliance with KYOTO protocol • Potential Sectoral GHG Emission Mitigation Strategies • Policies, Measures, and Instruments • Introduction to GHG Mitigation Economics • Mitigation Assessment
Why Might We Mitigate? • Greenhouse gas forcing is causing climate change • International agreements under UNFCCC - Kyoto Protocol • International pressures for emission reduction • Domestic policies at national or state level • Industry planning under uncertainty • Need for cheap emission offsets • Congruence of programs with other agriculturally related societal desires such as farm income support and water quality protection • Development of another market for farm products
Greenhouse gas forcing is causing climate change • Basic argument is that GHG emissions are increasing earth’s heat trapping and climate is warming • See climate change effects notes for discussion
Brief History of the International Agreements on Mitigation UNFCCC : United NationsFramework Convention on Climate Change • Adopted on May 9, 1992 and ratified by 176 governments worldwide as of October 1998 • Developed plans for responding to climate change “... to achieve ... stabilization of greenhouse gas concentrations in the atmosphere at a level that would prevent dangerous anthropogenic interference with the climate system” (p.9). • Established to negotiate net GHGE reduction • Under it’s auspices, the KYOTO Protocol was adopted in 1997.
The KYOTO Protocol • The first major international agreement towards GHGE reduction • Industrialized countries agreed to reduce emissions of six greenhouse gases baskets [CO2, CH4, N2O, HFCs, CFs, SF6] to 5-8% below 1990 levels between 2008 - 2012. • GHGs are compared to each other using global warming potential (GWP) coefficients • Treatment of emissions of GHGs from land-use change • Approval of offsets through enhancement of sinks • Authorization of mechanisms to reduce the cost of meeting the target
The KYOTO Protocol – Mechanisms Mechanisms to reduce the cost of meeting the above target • International Emissions Trading (Article 17) Allows the trading of assigned amounts within or among industrialized countries to meet quantified emission limitation or reduction commitments. • Clean Development Mechanism (CDM) (Article 12) Allows industrialized countries to finance emission reductions in developing countries to help in sustainable development and receive emission credits for doing so. • Joint Implementation (JI) (Article 6) Allows Annex I transferring/acquiring emission reductions resulting from activities aiming to reduce anthropogenic emissions by sources or enhance anthropogenic removals by sinks.
The KYOTO Protocol – Mechanisms • Joint Action or Bubbles (Article 4) Agreement among regional groups to achieve their reduction targets jointly provided that their combine aggregated anthropogenic emissions of GHGs do not exceed their quantified emission limitation and reduction commitments. Source: Kyoto Protocol at http://www.sdinfo.gc.ca/docs/en/kyoto/Default.cfm
The KYOTO Protocol – Mechanisms • Joint Action or Bubbles (Article 4) Agreement among regional groups to achieve their reduction targets jointly provided that their combine aggregated anthropogenic emissions of GHGs do not exceed their quantified emission limitation and reduction commitments. Source: Kyoto Protocol at http://www.sdinfo.gc.ca/docs/en/kyoto/Default.cfm
GHG Market Equilibrium D Price S P* Quantity Q*
GHG Market Equilibrium with cap D Price S P P* Quantity Q*
GHG Market Equilibrium with cap - Why there? D+E D Price S P P* Quantity Q*
Multi region GHG Market Equilibrium with cap – Autarkic, no trade D D Price S S P P* Capped region Quantity Q* Quantity Uncapped Region Quantity Q*
Multi region GHG Market Equilibrium with cap – with trade D D Price S S ES ED P P P* Capped region Quantity Q* Quantity Uncapped Region Quantity Q*
Multi region GHG Market Equilibrium with cap – with trade and transactions costs D D Price S S ES ED P P Transactions Costs P* Capped region Quantity Q* Quantity Uncapped Region Quantity Q*
The KYOTO Protocol – U.S. cost of compliance with the KYOTO • The Kyoto Protocol would have required the US to reduce its emissions 7% from 1990 levels from 2008 to 2012. • To comply US emissions must decline by 30% from projected 2010 levels which results in a GDP loss of about 1-4% annually (Weyant 1999). Figure 8. Carbon tax under alternative trading regimes Figure 9. GDP loss under alternative trading regimes Source: Weyant, J. P. (ed.) The Costs of the KYOTO Protocol: A Multi-Model Evaluation, a special issue of The Energy Journal, p. xxxi, and xxxiii, 1999.
Magnitude of U.S. GHG Emissions Source EPA Inventory of U.S. GHG Emissions Inventory 2011
GWP and Climate Change GWP is used to make comparisons of relative contributions among GHGs to global warming by comparing the ability of each gas to trap radiation in the atmosphere over a chosen time horizon. IPCC uses CO2 as a reference gas with a GWP of 1. HFC-23 260 940012000 10000 CF-4 >50,000 3900 5700 8900 SF-6 3200 15100022200 32400 Source: Climate Change 2001: The Scientific Basis, Table 6.7: Direct GWP athttp://www.grida.no/climate/ipcc_tar/wg1/248.htm#tab67
Multigas value The EMF did a comparison between mitigating GHGs with CO2-only and multi-gasses The results examined a scenario that attained a stabilization target that stabilized radiative forcing at 4.5 Wm-2 relative to pre-Industrial times by 2150. They found show that under multi-gas mitigation versus CO2 only that the reductions are much cheaper if all are managed. Carbon Permit Price (2000 $US/tCe) Essentially, less costly reductions in NonCO2 gases are displacing more costly reductions in CO2 from the energy sector. Source http://emf.stanford.edu/publications/emf_21_multigreenhouse_gas_mitigation_and_climate_policy/
Other reasons Why Might We Mitigate? • Domestic policies at national or state level • Clean skies 18% reduction in intensity • 4 pollutants NOX,SOX,Mercury,CO2 • State initiatives • Voluntary registry • International pressures for emission reduction • European pressure
Other reasons Why Might We Mitigate? • Domestic policies at national or state level • Clean skies 18% reduction in intensity Source EPA Inventory of U.S. GHG Emissions Inventory 2011
Other reasons Why Might We Mitigate? Industry planning under uncertainty • Demonstration projects • Interests at risk • Multinationals • Need for cheap emission offsets • Firms investing • CCX • Congruence of programs with other agriculturally related societal desires such as farm income support and water quality protection • Development of another market for farm products
Relative size of Agriculture Emissions Agriculture is largest source (EIA) Emissions rose via EPA estimates from 195 in 1990 to 215 in 2008 IPCC data
Historical Emissions Estimates Sequestration may have the potential to alleviate somewhere in the neighborhood of 25% of the historical atmospheric greenhouse gas accumulation. Source: Apparently this was drawn from W. F. Ruddiman, 2001. Earth's Climate: Past and Future. W. H. Freeman and Sons, New York
Why is this happening - Emissions growing Emissions growing this figure goes to 2006 http://www.epa.gov/climatechange/emissions/globalghg.html
Why is this happening - Emissions growing List of countries by 2007 emissions http://en.wikipedia.org/wiki/List_of_countries_by_carbon_dioxide_emissions
1- Per-capita fossil-fuel CO2 emissions, 2005 World emissions: 27 billion tons CO2 AVERAGE TODAY STABILIZATION Source: IEA WEO 2007 and Socolow presentation at Americas Climate Choices
“Stabilization”: 1 ton CO2/yr per capita It is not sufficient to limit emissions in the prosperous parts of the world and allow the less fortunate to catch up. Such an outcome would overwhelm the planet. The emissions of the future rich must eventually equal the emissions of today’s poor, … …not the other way around. Socolow presentation at Americas Climate Choices
Potential Sectoral GHG Emission Mitigation Strategies • Agricultural and Forestry Sector • Contributed 4% of global energy-related CO2 emissions in 1995 but about 50% of methane and 70% of nitrous oxide • Conservation Improvement of agriculture (e.g. conservation tillage, reduction of land use intensity, etc.) • Sequestration management • Substitute product production (biofuels) • Altered ag management of cattle, rice, fertilization • Fuel switching • Waste Management Sector • Use of landfill gas for heat and electricity • Increase of waste recycling rates • Utilize waste paper as a biofuel • Energy Sector • Contributed 38 % of global energy-related CO2 emissions in 1995 • Improvement in the energy efficiency of power plants • Fuel switching • Deregulation of the electric power sector to drive technological progress
Potential Sectoral GHG Emission Mitigation Strategies • Buildings Sector • Contributed 31% of global energy-related CO2 emissions in 1995 • Improvement in the energy efficiency of windows, lighting, refrigeration, air conditioning, etc. • Passive solar design & integrated building • Fuel switching • Transportation Sector • Contributed 22 % of global energy-related CO2 emissions in 1995 • Improvement in the energy efficiency of vehicles • Vehicle Fuel switching to natural gas, electricity, biofuels • Subsidize mass transit • Industry Sector • Contributed 43 % of global energy-related CO2 emissions in 1995 • Improvement in the energy efficiency • Material efficiency improvement e.g. recycling, material substitution • Fuel switching Adapted from CC 2001 mitigation p. 29-40
Potential Sectoral GHG Emission Mitigation Strategies IPCC WGIII 2007
ClimateChangeMitigationChallenge Complex set of sources Energy is key Tie to Development Multinational need BRIC countries Futility of unilateral action Legislation Offset controversy
Policies, Measures, and Instruments Here are a set of policies, measures, and instruments to limit GHG emissions or enhance sequestration by sinks. • Command and control • Taxes on emissions, carbon, and/or energy • Subsidies • Tradable emissions permits (cap-and-trade) • Non-tradable permits • Emission reduction credits • Voluntary agreements • Technology and performance standards • Product bans • Direct government spending and investment (R&D) Adapted from CC 2001 mitigation p. 399-450 http://www.grida.no/climate/ipcc_tar/wg3/224.htm
Policies, Measures, and Instruments • Command and Control • Imposing a specific and inflexible emission standards on sources • Taxes on Emissions, Carbon, and/or Energy • A levy imposed by a government on each unit of emissions or on carbon content of fossil fuels (carbon tax), or on the energy content of fuels • Advantage: 1. Yields cost minimizing allocation 2. Promotes technological progress 3. Increases revenues to subsidize R&D • Disadvantage: 1. How to determined an appropriate level of Tax? Cost ($) Marginal control cost A B Tax C O Emission Reductions (tons) 15 D
Policies, Measures, and Instruments • Subsidies • A direct payment from the government • Lowersexisting subsidies to fossil fuel use, or increasing subsidies for practices reducing emissions or enhance sinks • Tradable Emissions Permits (Cap-and-Trade) • Puts a cap or limit on aggregate GHG emissions on sources • Requires each source to hold permits equal to its actual emissions • Allows permits to be traded among sources • Advantage: Flexibility • Disadvantage: Need to consider transaction costs • Non-Tradable Permits • Puts a cap or limit on GHG emissions on each regulated source • Requires each source to keep its actual emissions below its own cap • Does not allow trading among sources
Policies, Measures, and Instruments • Emission Reduction Credits • Combination of a deposit or fee (tax) on a emissions with a refund or rebate (subsidy) for emission reductions • Credits are implemented through • Offset policy • Bubble policy • Netting within the firms • Banking • Advantage: allow growth • Disadvantage: quantifiability, and monitoring and enforcement
Policies, Measures, and Instruments • Voluntary Agreements • An agreement between a government authority and one or more private parties • A unilateral commitment to achieve environmental objectives or to improve environmental performance beyond compliance • Technology and Performance Standards • Establishment of minimum requirements for products or processes to reduce GHG emissions associated with the manufacture or use of the products or processes • Product Bans • Prohibition on the use of a specified product in a particular application, such as hydrofluorocarbons (HFCs) in refrigeration systems
Policies, Measures, and Instruments • Direct Government Spending and Investment (R&D) • Government expenditures on research and development (R&D) measures to lower GHG emissions or enhance GHG sinks Remarks: (1). A group of countries can implement one or a combination of these instruments. (2). If we control too much at the present time, the current generation pays high price but the future generation gains benefit, or a vice versa. Adapted from CC 2001 mitigation p. 399-450 http://www.grida.no/climate/ipcc_tar/wg3/224.htm
Policy Directions • Policy toward climate change consists of three elements: • Let it happen – ignore • Pursue mitigation (reducing the extent of climate change), • Pursue adaptation (reducing the impact of change), and Schematic from Parry, 2009
Policy Sensitivity • Let it happen – ignore or only reduce • Effects on previous page • Pursue mitigation (reducing the extent of climate change) • Energy will be major thrust • De carbonize • Tax • Pursue renewable • So may be agricultural activities • Land use change – domestic and ILUC • Sequestration – tree planting, grass, tillage • Emissions, fossil fuel use, enteric, manure, rice • Offsets – biofuel and bio electricity – watch out for LUC • Pursue adaptation (reducing the impact of change) • Maintenance of current productivity • Autonomous – varieties, planting dates, crop mix, enterprise choice • Facilitating adaptation • R&D on adapted varieties, practices • Extension • Facilities • Compensation (international) • Resource competition from both
Where we are Lag until effectiveness Degree of climate change - What is projected Climate models predict increasing emissions will cause a temp increase Source : IPCC AR4t
500 Competitive Potential Economic Potential 400 300 Technical Potential C price ($/tCeq) 200 100 0 0 20 40 60 80 100 120 140 160 Soil carbon sequestration (mmtce) Q: Can We Identify the Competitive Potential for U.S. Ag & Forest Options? Example: U.S. ag soil potential: Source: B. McCarl and U. Schneider, presented at 2001 EPA-USDA Forestry and Agriculture Greenhouse Gas Modeling Forum.
ALTERNATIVEOFFSETSCENARIOSEPA ANALYSIS OF THE CLIMATE SECURITY ACT OF 2008: S. 2191 (MARCH 2008) No offsets 15/15 Unlimited offsets
Example of Acid Rain Program • SO2 and NOx are the primary causes. • Acid rain occurs when these gases react in the atmosphere with water, oxygen, and other chemicals to form various acidic compounds. • This acid rain program is designed to reduce emission of SO2 AND NOx by 10 million tons below 1980 levels at the lowest cost to society. • How does this program work? • Technology improvement • Fuel switching • Conserves energy • Allows Trading System • Auctions and Direct Sales • Opt-in Program • Etc. http://www.epa.gov/airmarkets/acidrain/#what
Example of Acid Rain Program – allowance trading system • EPA sets allowances based on historical fuel consumption and emission rates. • Allowance trading provides incentives for energy conservation and technology innovation that can both lower the cost of compliance and yield pollution prevention benefits. • Regulated firms decide the most cost-effective way to use available resources to comply with the acid rain requirements by • employing energy conservation measures • switching to a lower sulfur fuel • employing pollution control technologies, etc. • Firms that reduce their emissions below their regulated allowances may trade their allowances, sell them on the open market or through EPA auctions, or bank them to cover emissions in future years. Source:EPA’s Acid Rain Program: Overview at http://www.epa.gov/airmarkets/arp/overview.html
Example of Ozone Depletion Program • The ozone layer acts as a blanket in the stratosphere that protects us from harmful UV radiation. CFC-12 destroys this layer of gas which leads to an increase in cataracts and skin cancer. • The largest uses of CFC-12 is as a refrigerant in motor vehicle air conditioners • Firms are given funds to switch from ozone pollutable to other sources. • Taxes on ozone • Certification Requirements • Regulation on service shops must certify to EPA that they have acquired and are properly using approved refrigerant recovery equipment, and that each person using the equipment has been properly trained and certified. • Global Action to Protect the Ozone Layer • Montreal protocol => agreement to phase out production of most ozone-depleting substances Source:EPA Regulatory Requirements athttp://www.epa.gov/ozone/title6/609/justfax.html
Introduction to GHG Mitigation Economics – Emissions Tax Marginal cost/Price D S Tax Figure 1. Supply and Demand For Energy/Carbon Quantity of Emissions (tons) Carbon Tax ($/ton) MC Figure 2. Marginal Cost Curve for Carbon Emission Reductions Emission Reduction (tons) Source: Weyant, J. P. (ed.) The Costs of the KYOTO Protocol: A Multi-Model Evaluation, a special issue of The Energy Journal, p. xxxi, and xxxiii, 1999.
Introduction to GHG Mitigation Economics – Emissions Trading Country A Country B MCa MCb Ta Tb’ Ta’ Tb A1 A2 B2 B1 Ra Rb’ Ra’ Rb Emission Reductions (tons) Figure 3. Two Country Example of International Emissions No trade: Cost of emission reductions to A is A1+A2, to B is B1. With trade: Cost of emission reductions to A is A1, to B is B1+B2. Total global cost is reduced by A2 – B2 Total emission reductions = Ra’ + Rb’ = Ra + Rb Source: Weyant, J. P. (ed.) The Costs of the KYOTO Protocol: A Multi-Model Evaluation, a special issue of The Energy Journal, p. xxxi, and xxxiii, 1999.