Download

1 / 13
130 likes | 192 Views
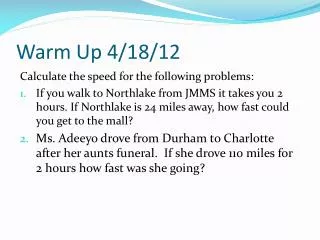
Warm Up Use the table for problems 1 and 2. 1. In which week did Alicia save the most? 2. How much did Alicia save in all?. week 3. $25. Problem of the Day

E N D
Warm Up Use the table for problems 1 and 2. 1. In which week did Alicia save the most? 2. How much did Alicia save in all? week 3 $25
Problem of the Day A health club charges $100 to join and $25 per month. There is also an $8 fee per aerobic class. Julia joins the health club for 4 months and takes 12 aerobic classes. What is her total cost? $296
Ex. 1: Matching Situations to Graphs The graphs show the speeds of two cars over time. Tell which graph corresponds to each situation. Mr. Lee is traveling on the highway. He pulls over, stops, then accelerates rapidly as he gets back on the highway. Graph 2
Ex. 2: Matching Situations to Graphs The graphs show the speeds of two cars over time. Tell which graph corresponds to each situation. Ms. Montoni slows down as she leaves the main road. She continues to slow down as she turns onto other streets and eventually stops in front of her house. Graph 1
Example 3 Tell which graph corresponds to the situation. A kite flew for a few minutes, and then suddenly fell to the ground. Graph 1 is the graph that corresponds to the situation.
Time 8:00 8:30 12:00 12:30 Temp.(F) 71 71 82 74 Temp (F) Time Ex. 4: Creating a Graph of a Situation Create a graph for the situation. Tell whether the graph is continuous or discrete. The table shows the temperature inside a car over time. Car Temperature Since every value of time has a corresponding altitude, connect the points. The graph is continuous.
Cost($) Pumpkins Purchased Ex. 5: Creating a Graph of a Situation Create a graph for the situation. Tell whether the graph is continuous or discrete. A market sells pumpkins for $5 each. Pumpkin Cost The cost (y-axis) increases by $5 for each pumpkin purchased (x-axis). Because each person can only buy whole pumpkins or none at all, the graph is distinct points. The graph is discrete.
Example 6 Create a graph for the situation. Tell whether the graph is continuous or discrete. The table shows the amount of money in Yuri’s bank account at the end of each day. This is a discrete graph.
Example 7 Create a graph for the situation. Tell whether the graph is continuous or discrete. The table shows thewater temperature in a swimming pool over24 hours. This is a continuous graph.
Lesson Quizzes Standard Lesson Quiz Lesson Quiz for Student Response Systems
Lesson Quiz Tell which graph corresponds to the situation. Then tell whether the graph is continuous or discrete. A bus pulls out from the gas station. It drives to its first stop. Then the bus gets on the expressway. Graph B; continuous
Lesson Quiz for Student Response Systems 1. Maggi has $25 in her bank account. She gets $5 every day from her father and deposits the money in the account for the first three days. On the fourth day, she buys a hat for herself with the money. Identify the table that corresponds to this situation. • B.