Download
1 / 21
210 likes | 291 Views
Sprawl Dynamics. Prof. Philip C. Emmi College of Architecture + Planning University of Utah RailVolution 2005. SimTropolis. Dynamic yet Radically Simplified Metro-Regional Scale Integrated Urban Land Use & Transportation Scenario Generator For the Exploration of Alternative Urban Futures.

E N D
Sprawl Dynamics Prof. Philip C. Emmi College of Architecture + Planning University of Utah RailVolution 2005
SimTropolis • Dynamic yet Radically Simplified • Metro-Regional Scale • Integrated Urban Land Use & Transportation Scenario Generator • For the Exploration of Alternative Urban Futures
At Higher Intensities, More Land is Needed for People and Jobs As Urban Land Develops, Traffic and Vehicle Miles Traveled Increases Increased Travel Demand Leads to More Roads Increased Road Capacity Induces Intensity Increases 1 2 4 3 Self-Reinforcing Relationship between Urban Land Development Urban Road Building Sprawl Feedback
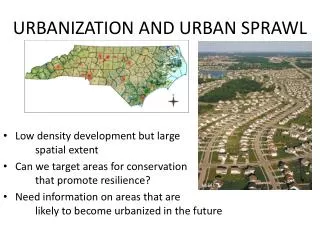
Study Area and Time Horizon • Urbanized Portions of the Salt Lake, Davis and Weber Counties • Initialized with 1980 data • Model calibration data: 1980 - 2000 • Validation experiments • Calibration: 1980 - 1992. • Project and compare with 2002 observations • Projection and policy horizon: 2030
Test Experiment #1 • Divide the 1980 - 2002 data set into 2 halves • Calibrate the model on data from 1980-1992 • Project to 2002, compare with 2002 observations and note the errors • Find the RMS error of the projections for: • Urban Land, VMTs, Road Miles & Density • RMS Error is found to be low
Test Experiment #2 • Note slight logarithmic structure to data on Ac\Person as a function of Road Miles. • Fit a logarithmic function to the data. • Use it in place of a linear function. • Note effects on year 2030 simulations. • In the baseline scenario, values are 10-15% lower. • In other scenarios, values are 1 - 3% lower.
Test # 3 (Incomplete) • Note that there is little agreement among alternative data series on urban land. • Would the model behave differently if another data series on urban land were used? • Would the model behave differently if it were calibrated on the CO Front Range? • Does the model’s data determine its characteristic behavior or its structure? • Does the model’s data or its structure determine the (in)accuracy of its historical simulations?
Four Alternative Future Scenarios • Baseline: an extension of historic practice • Land Use: Increase new development densities by 20% • Transportation: Reduce single-occupancy vehicle trips to 80% of total Increase existing road capacity by 12% Speed up TIP implementation from 5 to 3 years • Combine Land use & Transportation
Extensions • Agricultural land preservation • Water use and conservation • Urban forest and canopy cover • Vehicle fuel and energy use • Carbon dioxide emissions • Criteria air pollutants
Conclusions about Urban Dynamic System Models • They are simple to understand • They are highly accurate • They are easy to manipulate • They illustrate dynamic complexity • They generate alternative policy scenarios • They facilitate learning about policy options • They might facilitate policy negotiation