Download
1 / 30
310 likes | 503 Views
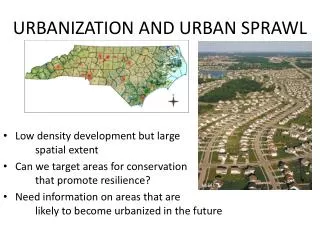
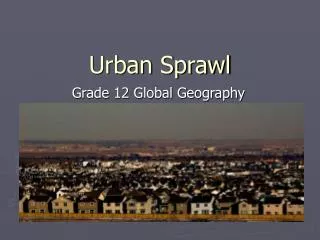
Parameterisation of Urban Sprawl. Amon Boontore. Optional Title. S p r a w l. P l a n i m e t e r. +. Slpanimeter. Outline. Main Objective 2) Operational Indicators of Urban Sprawl 3) Pilot Study 4) Future Works. Main Objective. Geographical Distribution of Land-uses.

E N D
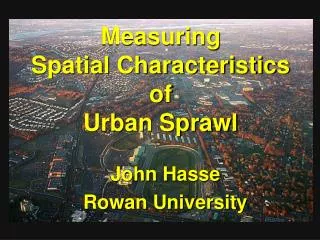
Parameterisation of Urban Sprawl Amon Boontore
Optional Title S p r a w l P l a n i m e t e r + Slpanimeter
Outline • Main Objective • 2) Operational Indicators of Urban Sprawl • 3) Pilot Study • 4) Future Works
Main Objective Geographical Distribution of Land-uses Distance Travelled Urban Sprawl Geographical Separation Measurement is a key initial step in scientific understanding (De Cola & Lam 1993). Travel Characteristics Indicators Definitions
First Used Perhaps diffusion is too kind of word...in bursting its bounds, the city actually sprawled and made the countryside ugly...uneconomic [in terms] of services and doubtful social value. Earle Draper
Definitions of Urban Sprawl Sprawl is the spread-out, skipped over development that characterises the non-central city metropolitan areas and non-metropolitan areas … (Ewing 1997). Sprawl is a pattern of land use in an urbanised area that exhibits low levels of some combination of eight distinct dimensions: density, continuity, concentration, clustering, centrality, nuclearity, mixed uses, and proximity (Galster et al 2001). …low-density development beyond the edge of service and development, which separates where people live from where they shop, work, recreate, and educate-thus requiring cars to move between zones (Seirra Club 1998). The term is used variously to mean the gluttonous use of land, uninterrupted monotonous development and inefficient use of land (Peiser 2001). 1. Low residential density 2. Unlimited outward extension of new development 3. Spatial segregation of different types of land uses through zoning regulations 4. Leapfrog development 5. No centralised ownership of land or planning of development 6. All transportation dominated by privately owned motor vehicles 7. Fragmentation of governance authority over land uses between many local governments 8. Great variances in the fiscal capacity of local governments 9. Widespread commercial strip development along major roadways 10. Major reliance upon the filtering or “trickle-down” process to provide housing for low-income households (Transportation Research Board 1998).
Characteristics of Urban Sprawl • Form • 2) Density • 3) Land-use Pattern • 4) Urban Process • 5) Impacts • 6) Dependent Variable • 7) Aesthetic • 8) Example Subjective 1) Low Density 2) Spatial Seclusion 3) Single Functional Use Research Approach Time & Data Limitation Prejudgement Prejudgement Subjective Subjective
Sprawl Conceptual Variables & Indicators 1) Low Density 1.1) Density Residential Land-use Density Density Gradients Urban Density Residential Density 2) Spatial Seclusion 2.1) Evenness 2.2) Complexity 2.4) Centralisation Entropy 2.3) Clustering Thiel’s Index ACI PAR Atkinson Geary’s Coefficient Centralisation Index Fractal Dimension Index of Dissimilarity Gini Moran’s I 3) Single Functional Use 3.2) Exposure 3.1) Concentration Interaction Index CTG ICO Duncan’s Delta IJI ETA ISO Relative Concentration Index
Sprawl Conceptual Variables & Indicators City A i, j, k = number of tract = Total developable land area = Area of developable land in tract i = Total residential land area = Area of residential land in tract i = Total non-residential land area = Area of non-residential land in tract I = Total developed land area = Area of developed land in tract i = Total residential proportion = Residential Proportion in tract i City tract A1 = 100 City tract A2 = 100
Sprawl Conceptual Variables & Indicators 2.1) Evenness Index of Dissimilarity:
Sprawl Conceptual Variables & Indicators 3.1) Concentration Relative Concentration Index:
Sprawl Conceptual Variables & Indicators 3.2) Exposure Interaction Index:
Pilot Study: Data & Methodology Land cover maps CORINE (Coordination of Information on the Environment) European Environment Agency Year 2000 250 metres resolution Transportation Data International Association of Public Transport (UITP) Distance Travelled Data 30 Maps Year 1995 Case Studies Austria: Graz, Vienna; Belgium: Brussels; Denmark: Copenhagen; Finland:Helsinki; Paris:Lyon, Marseille, Nantes, Paris; Germany: Berlin, Frankfurt, Hamburg, Dusseldorf, Munich, Stuttgart; Greece: Athens; Italy: Milan, Bologna, Rome; Netherlands: Amsterdam; Spain: Barcelona, Madrid; Sweden: Stockholm; UK:Glasgow, London, Manchester, Newcastle
Pilot Study: Data & Methodology Overall Mobility (daily trips/cap) – Foot Mechanised modes Public modes Private modes Daily Km/cap Mechanised Private Public Motorised All Motorised modes Overall average trip distance (km/trip) Car Public modes Mechanised modes Private modes Motorised modes
Pilot Study: Data & Methodology Residential land Non-residential land Continuous urban fabric Industrial and commercial units Discontinuous urban fabric Airports Port areas Green urban areas Sport and leisure facilities Developable land Construction sites Olive groves Rice fields Annual crops Vineyards Natural vegetation Mixed forest Pastures Coniferous forest Undevelopable land Non-irrigated arable land Woodland-schrub R Dump sites Mineral extraction sites N Sparsely vegetated areas Sea and ocean Burnt Areas Complex cultivation patterns Salines Estuaries Salt marshes Water bodies Moors and heathland Permanently irrigated land Inland marches Peat bogs Beaches, dunes, sands Agro-forestry areas Broad-leaved forest Bare rocks Water courses Natural grasslands Sclerophyllous vegetation Intertidal flats Glaciers and perpetual snow Fruit trees and berry plantations Coastal lagoons Road and rail networks and associated land
Pilot Study: Data & Methodology 1 2 3 4 5 6 7 8 9 10 11 12... ...n
Pilot Study: Data & Methodology Data Sourcing Evenness: IOD Concentration: RCO Exposure: INT
Pilot Study: Results R2 = .176 Sig. = .003
Pilot Study: Results Grouping of Case Studies Range (million m2) n XS 158-716 5 S 1182-3666 9 SM 4796 1 4997-7834 M 10 L 10533-12521 4 44761 1 XL Total 30
Pilot Study: Results SM-M R2 = .883 Sig. = .002
Pilot Study: Results XS-S R2 = .549 Sig. = .006
Pilot Study: Results XS-S-SM R2 = .415 Sig. = .033
Pilot Study: Results S M XL XS SM L (9) (5) (1) (10) (4) (1) RCO-Private (12, .549, .006) IOD-Public (13, .342, .036) RCO-Private (13, .414, .018) IOD-Public (15, .305, .033) INT-Public (11, .415, .033) IOD-Mechanised (9, .714, .004) IOD-Mechanised (8, .683, .011) IOD-Mechanised (10, .733, .002) IOD-Mechanised (9, .705, .005) IOD-Mechanised (8, .833, .002) RCO-Motorised (20, .237, .03) RCO-Private (14, .374, .02) RCO-Motorised (15, .294, .037) RCO-Motorised (27, .176, .03)
Future Works 1 2 3 4 5 5x5 Km grid sq 6 7 8 9 10 11 12... ? Workable Grid Size Reduction of Indicators ...n
Future Works: Correlations 1) Low Density 1.1) Density Residential Land-use Density Density Gradients Urban Density Residential Density 2) Spatial Seclusion 2.1) Evenness 2.2) Complexity 2.4) Centralisation Entropy 2.3) Clustering Thiel’s Index ACI PAR Atkinson Geary’s Coefficient Centralisation Index Fractal Dimension Index of Dissimilarity Gini Moran’s I 3) Single Functional Use 3.2) Exposure 3.1) Concentration Interaction Index CTG ICO Duncan’s Delta IJI ETA ISO Relative Concentration Index

![Urban Sprawl [Date] Today I will: Know the causes, problems and solutions to Urban Sprawl.](https://cdn1.slideserve.com/1949902/slide1-dt.jpg)