Download
1 / 18
180 likes | 182 Views
Average Percent of 1st & 2nd Year Students in Classes Under 50, by Type of University, Maclean's 2004. Percent of 1st & 2nd Year Students in Classes Under 50, Top Ranked Undergraduate Universities, Maclean's 2004.

E N D
Average Percent of 1st & 2nd Year Students in Classes Under 50, by Type of University, Maclean's 2004
Percent of 1st & 2nd Year Students in Classes Under 50, Top Ranked Undergraduate Universities, Maclean's 2004
Figure 1. Percent of Direct Entry Students With Incoming Averages Above 75%, and Percent Change from 1994, 2004, Acadia, Mount Allison, StFX
Table 2. Entry Averages and First Year Performance, StFX, 1998-2004 Average Year of High % Above 75 % Below 55 Entry School University University ________ ________ __________ __________ 1998 77.9 14.8 24.1 1999 79.4 14.8 23.4 2000 79.2 19.4 20.6 2001 79.5 19.3 17.1 2002 80.6 19.4 18.7 2003 82.2 22.0 11.7 2004 83.9 . .
Figure 2. Percent First Year Averages Above 75, Percent Below 55, Students Entering StFX,1998-2003
Average High School and First Year Grades, Direct Entry Students, StFX 1998 - 2004
Figure 4. Geographic Origins StFX Incoming Students, 1998-2004
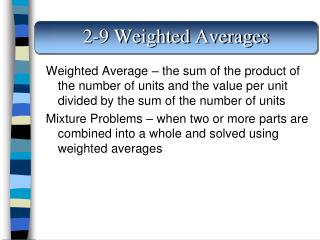
Measuring Satisfaction with Academic Programs • An index of satisfaction with the quality of the academic experience was created. The index combined six items measured using 9-point response categories. The items included three assessing the overall quality experienced by the respondents in their major department (see question 13 in the questionnaire): • Quality of content of courses • Quality of instruction • Helpfulness of faculty • Three questions (questions 24, 25, & 26) asked for a rating on three items relating to their overall satisfaction with the St. F.X. experience: • Overall, I feel a received a good education at St. F.X. • I would be delighted if a child of mine decided to attend St. F.X. • If I had to do it all over again, I would choose the same program • The index was tested for reliability and the test yielded a standardized item Alpha of .7657, considered to be acceptable for a 6 item index (the mean inter-item correlation was .35). The mean score for the respondents in 2003 was 45.5 (sd= 6.16). This score represents an average of 7.6 on each of the six 9-point scales or 84.3 percent of the highest possible score of 54 (9 x 6). Overall, the respondents are very positive about their experiences at St. F.X. There is also a positive trend in the overall measures of satisfaction when the satisfaction measures are compared with those taken in earlier surveys. For presentation purposes, the index measures were converted to a score out of 100.
Mean Satisfaction Scores by Area of Study, StFX Seniors, by Year *In 1997 and 1999 Information systems was included in the Applied Sciences category; in 2001 Information Systems is a department within the Schwartz School Of Business.
Percent of students Who Would Choose StFX If They Could Do It Over Again, by Year *In 1997 and 1999 Information systems was included in the Applied Sciences category; in 2001 Information Systems is a department within the Schwartz School of Business. Education graduates were inadvertently missed in the ’03 survey
Percentage of Program Revenue From Four Sources, StFX, 1983-2004
Scholarship Expenditures as % of Program Expenditures, StFX, 1983 - 2004
Unfunded Debt as % of Program Expenditures, StFX, 1983 - 2004