Download
1 / 11
110 likes | 122 Views
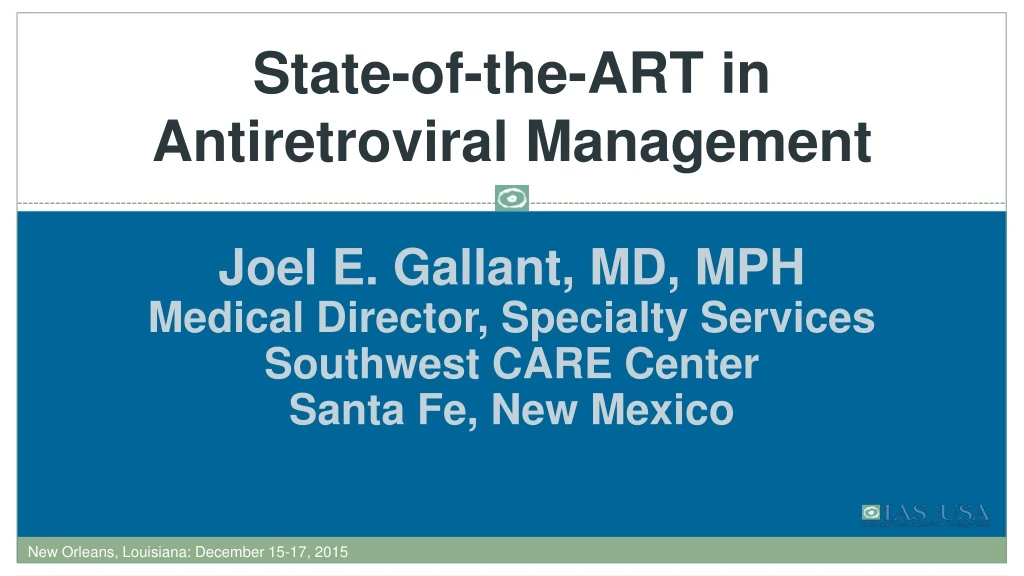
State-of-the-ART in Antiretroviral Management. Joel E. Gallant, MD, MPH Medical Director, Specialty Services Southwest CARE Center Santa Fe, New Mexico. FORMATTED: MM/DD/YY. New Orleans, Louisiana: December 15-17, 2015. Slide 6 of 38.

E N D
State-of-the-ARTin Antiretroviral Management Joel E. Gallant, MD, MPH Medical Director, Specialty Services Southwest CARE Center Santa Fe, New Mexico FORMATTED: MM/DD/YY New Orleans, Louisiana: December 15-17, 2015
Slide 6 of 38 START: 57% Reduced Risk of Serious Events or Death With Immediate ART • 1.8% vs 4.1% in deferred vs immediate arms experienced serious AIDS or non-AIDS related event or death: HR = 0.43 (95% CI: 0.30 to 0.62); P < .001 10 8 Deferred ART 6 Cumulative Percent With Event 4 Immediate ART 2 0 0 6 12 18 24 30 36 42 48 54 60 Month Lundgren J, et al. N Engl J Med. 2015
Slide 17 of 38 GS104/111: Smaller decline in hip and spine BMD with TAF • Smaller decline in hip and spine BMD with TAF P < .001 P < .001 TAF/FTC/EVG/COBI (n = 866)TDF/FTC/EVG/COBI (n = 867) 2 2 -0.66 Mean % Change From BL -1.30 0 0 -2.86 -2.95 -2 -2 -4 -4 -6 -6 0 0 48 24 0 0 24 48 Wk Wk n n =845=850 797816 784773 836848 789815 780 767 Sax P, et al. CROI 2015. Abstract 143.
Slide 19 of 38 GS 104/111: TAF vs. TDF: Quantitative Proteinuria Urine [protein]:Creatinine Ratio Protein (UPCR) Protein (UPCR) Albumin (UACR) Albumin (UACR) RBP RBP Beta2- microglobulin 76 133 168 Median % Change from Baseline (Q1, Q3) E/C/F/TAF E/C/F/TDF p <0.001 for all Sax P, et al. 22nd CROI; Seattle, WA; February 23-26, 2015. Abst. 143LB.
Slide 23 of 38 GS-109: Switch from TDF-based Regimens to E/C/F/TAF: Renal and Bone Outcomes • Hip BMD was similarly increased for pts treated with TAF regimen EVG/COBI/FTC/TAFTDF-Based Regimen 4 3 1.79 2 Median % Change in BMD (Q1, Q3) 1 P < .001 0 -1 -0.28 -2 -3 Baseline Week 24 Week 48 Mills A, et al. IAS 2015. Abstract TUAB0102.
Slide 24 of 38 GS-112: Switching to E/C/F/TAF Regimen With Renal Impairment (eGFR 30-60) • Multicenter, open-label phase III trial, N=242 (158 on TDF, 84 on non-TDF-based regimen) Changes in spinal BMD to Wk 48 Changes in eGFRto Wk 48 Total Total TDF Non-TDF TDF Non-TDF 10 4 Median Change from Baseline 2.95* +0.2 0 2.29* 2 -0.6 -1.5 -1.8 -1.8* -2.7* Mean % Change Spine BMD 0.99 0 -10 Baseline: 56 58 53 54 56 50 eGFRCGmL/min eGFRCKD-EPI CrmL/min/1.73m2 -2 *P < 0.05. *P < 0.05. Gupta S, et al. IAS 2015. Abstract TUAB0103.
Slide 26 of 38 GS 119: Virologic Suppression After Switch to EVG/COBI/FTC/TAF + DRV Similar rates of maintained virologic suppression at Wk 24, but significantly higher rates with switch vs baseline ART at Wk 48 97 94 91 100 EVG/COBI/FTC/TAF + DRV Baseline ART 76 80 Treatment difference: 5.3% (95% CI: -3.4 to 17.4; P = .23) Treatment difference: 18.3% (95% CI: 3.5 to 33; P = .004) 60 Patients (%) 40 13 11 20 9 2 2 3 1 0 0 VL< 50 No Data VL < 50 No Data Virologic Failure Virologic Failure Week 24 Week 48 Huhn S, et al. ID Week 2015. Abstract 726.
Slide 29 of 38 STRIIVING: Virologic Outcomes at Wk 24 • Switch to DTG/ABC/3TC noninferior to maintaining baseline ART • No cases of protocol-defined virologic failure • 3 pts in DTG/ABC/3TC arm (1%) and 4 pts in BL ART arm (1%) had VL > 50 but < 100 through Wk 24 Primary Efficacy Analysis: ITT-Exposed and Per Protocol Populations 93 93 100 Baseline ART DTG/ABC/3TC 88 85 ITT-E Population DTG/ABC/3TC (ITT-E, n = 274) Baseline ART (ITT-E, n = 277) DTG/ABC/3TC (PP, n = 220) Baseline ART (PP, n = 215) 80 -3.4 HIV-1 RNA < 50 c/mL (%) 60 -9.1 2.3 40 -12 -8 -4 0 4 8 12 PP Population 20 14 10 5 6 2 1 1 < 1 -0.3 0 VirologicSuccess VirologicNonresponse No Virologic Data -4.9 4.4 -12 -8 -4 0 4 8 12 Trottier B, et al. ICAAC 2015.
Slide 32 of 38 PADDLE: All Pts Virologically Suppressed by Wk 8 of DTG + 3TC • Included 4 pts with VL > 100,000 at BL Figueroa MI, et al. EACS 2015. Abstract 1066.
Slide 33 of 38 LATTE: Virologic Success Through Maintenance Week 96 • 6 pts in CAB arms with PDVF at Wk 96; 4 additional pts since Wk 48 Induction Phase Maintenance Phase 84% 75% 68% VL < 50 c/mL by Snapshot Algorithm (%) 100 63% 80 60 BL 4 12 24 28 36 48 72 96 Wks 40 CAB 10 mg (n = 60) CAB 30 mg (n = 60)* 20 CAB 60 mg (n = 61) *Cabotegravir 30 mg selected for future development Margolis D, et al. CROI 2015. Abstract 554LB. EFV 600 mg (n = 62) 0
Slide 34 of 38 Recent Switch Studies: Suppressed Patients Adapted from David Wohl