Download
1 / 31
330 likes | 541 Views
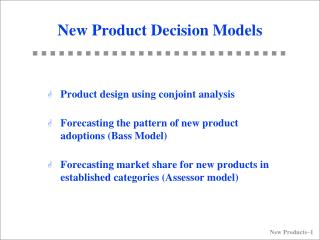
Business Intelligence/ Decision Models. Week 5 RFM Analysis. Outline. Explain how RFM works, and how you can use it to improve response rates SPSS RFM With transaction files With customer files Use of RFM with Target Variable. Recency, Frequency, and Monetary (RFM) Analysis.

E N D
Business Intelligence/Decision Models Week 5 RFM Analysis
Outline • Explain how RFM works, and how you can use it to improve response rates • SPSS RFM • With transaction files • With customer files • Use of RFM with Target Variable
Recency, Frequency, and Monetary (RFM) Analysis According to Hughes: • Used for marketing to customers • Always improves response and profits • Better than any demographic model • The most powerful segmentation method for predicting response
Old-fashioned RFM? • Never assume a CHAID program or even a regression model will outperform an old-fashioned RFM… (David Shepard)
Big Ticket: Response to $5,000 CD Offer by Monetary Percentage of households promoted who purchased 2 1.68 1.5 1.17 1 0.88 0.66 0.5 0.32 0 5 4 3 2 1 Monetary Quintile
F 5 M 35 335 4 34 334 3 33 333 332 32 2 331 31 Twenty-five sorts 1 Five Sorts Database One Sort RFM Code Construction 1 R
RFM Code Construction 2 R F M 5 5 5 4 4 4 3 3 3 2 2 2 1 1 1 DB 1st Sort DB 2nd Sort DB 3rd Sort
RFM Code Construction 3 • Predefined subjective breaks: • R = < 2 wks, 2-6 wks, 7-8 wks, and > 12 wks • F = 10, 8, 6, 3, 1 • M = > $500, $300-500, $200-300, $100-200, < $200,
RFM Code Construction 4 • R = 5, 4, 3, 2, 1 @ weight = 10 • F = 5, 4, 3, 2, 1 @ weight = 5 • M =5, 4, 3, 2, 1 @ weight = 1 • Weighted sum • Score = xiwi
F 5 M 35 335 4 34 334 3 33 333 332 32 2 331 31 Twenty-five sorts 1 Five Sorts Database One Sort Let’s stick with this one! R
Break Even Response Rate • BE = Unit Cost / Unit Profit • Example: • Unit cost = .55 • Unit profit = $33 • Thus $.55 / $33 = 0.0167 or 1.67%
Number of Cells • 5 x 5 x 5 = 125 cells • How many individuals per cell so that response is significant? • Minimum 4 / BE • Ex. 4 / .0167 = 240 individuals per cell • # of customers +/- 30,000 • Use Common sense: 5x4x4, or 5x4x3, or 5x2x2, or 4x2x3
Systematic Sampling: Selecting every Nth case Customer Database 300,000 Records For Nth by 10, select every tenth record. Nth Result will be a statistical replica of the database 30,000 Records
Break Even Index (BEI) • BE = .01375 to be set at 0 or 100 • Assume Response = .025 • If BEI set to 0 • BEI = [(Resp – BE)/BE] * 100 • Ex. [(.025 - .01375)/.01375]*100 • Ex. 81.82 82 • If BEI set to 100 • BEI = [Resp/BE] * 100 • Ex. [.025/.01375] * 100 = 181.82 182
Case Study • # of customers 2,100,000 • Test with 30,000 • Left with 2,070,000 • If 555 RFM 125 cells • 16,560 customers per cell
Test Response Rate by RFM Cell 34/125 cells above BE
Test, Full File & RFM Selects Compared 16,560 per cell X 34 cells = 563,040 Vs. 554,182 in textbook
SPSS Procedure • Compare Means Means • DV Response Variable (0/1) • IV RFM (Means and N) • Copy output table to Excel • Sort all columns by mean response • Descending order • Determine BE
Bits and Pieces • Recency with continuity: • Change in buying decisions • Frequency? • Purchases in year or # of items • Transactions in a year • # of visits, # of calls • Profitability? • Tests and Rollouts
Test Vs Rollout Response Rates Test = Lines Rollout = Bars
WhenNOT to use RFM • If you use it all the time, half your customers will never hear from you; they will be lost • The others will suffer from File Fatigue • Use it sparingly; when you need a boost • Use it to identify your best customers • Don’t go hog wild!
Top line from Chapter 6-1RFM Analysis • RFM has been used for more than 60 years. It is used only for customers, not prospects. • It tells you which direct mail customers not to mail to because their response rates will be below breakeven. • RFM does not work well for e-mail, because the cost of mailing is so low, you might as well mail them all. The formula for the breakeven response rate for a group of direct mail customers is: BE = Unit Cost/Unit Profit • In recency, the top quintile (5) has response rates very much higher than the next lower quintile (4). • Every RFM cell has exactly the same number of customers as any other RFM cell. • RFM is cheap to use. You do not need to know anything about statistics. • Frequency is not as predictive as recency. The lowest quintile in frequency usually has a surprisingly large response rate because is contains lots of recent buyers.
Top line from Chapter 6-2RFM Analysis • For low ticket items (less than $120), frequency is seldom predictive. It is very predictive of responses for big ticket items. • For typical RFM, you sort the file 31 times and end up with 125 RFM cells from 555 down to 111. • For an RFM test, you use an Nth which is an exact statistical replica of your main file. • Once you have done a test mailing, you know which RFM cells were profitable. You mail to only those cells on the rollout. • There is free software for a trial of RFM. It is located at www.dbmarketing.com. • For a business-to-business mailing, 125 cells is usually too many. Cut it down by reducing frequency or monetary, such as 5 × 2 × 2 = 20. • RFM is the basis of any good predictive model.
Top line from Chapter 6-3RFM Analysis • Don’t use RFM all the time. Use it when you want to make a good impression. • Frequency is often difficult to quantify. • RFM does not measure LTV or profitability. • Rollout response rates do not do as well as test response rates. Why? Because marketers cannot leave well enough alone.