Download
1 / 23
230 likes | 354 Views
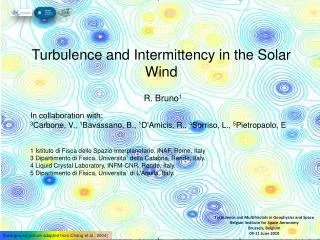
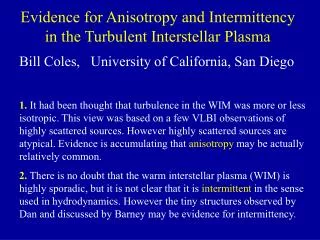
Turbulence in the magnetosphere studied with CLUSTER data : evidence of intermittency. Lamy H. 1 , Echim M. 1,2 , Darrouzet F. 1 , Lemaire J. 3 , Décréau P. 4 , Dunlop M. 5 1 Belgian Institute of Space Aeronomy , Brussels , Belgium 2 Institute of Space Sciences, Bucharest , Romania

E N D
Turbulence in the magnetosphere studied with CLUSTER data : evidence of intermittency Lamy H.1, Echim M.1,2, Darrouzet F.1, Lemaire J.3,Décréau P.4, Dunlop M.5 1Belgian Institute of Space Aeronomy, Brussels, Belgium 2Institute of Space Sciences, Bucharest, Romania 3Center for Space Radiations, Louvain-La-Neuve, Belgium 4LPCE/CNRS, University ofOrléans, France 5Rutherford Appleton Laboratory, United Kingdom
Outline of the talk • Turbulence/Intermittency • Turbulence in the Cusp • CLUSTER data • Probability Distribution Functions (PDF) • Flatness • Correlation coefficients (auto and cross) • Conclusions & Perspectives
What is turbulence ? • A non-linear phenomenom resulting from the interaction between waves and eddies of many different scales. • In a turbulent regime, fluid and plasma parameters vary randomly in time and space Statistical approach
Classical turbulence (Kolmogorov 41) driving scale inertial scales dissipation scale Richardson cascade • Self-similarity • Localness of interactions Two main hypotheses :
Self-similarity/Intermittency • Self-similar fluctuations : if we magnify an arbitrary part, the statistical properties will be identical • Intermittent fluctuations : alternance of intervals with high activity with quiet intervals Brownian motion is self-similar The Devil’s staircase is intermittent
Several models of intermittency • Smaller eddies are less and less space-filling (ex : the model, Frisch 1995) • The energy transfer rate is scale-dependent (ex : the p-model, Meneveau & Sreenivasan 1987)
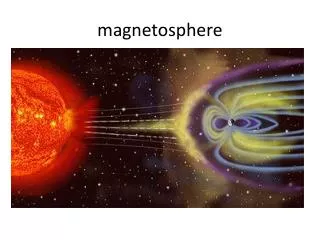
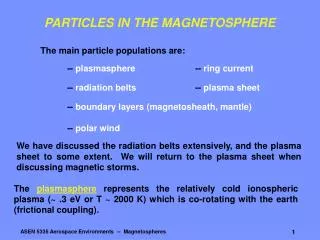
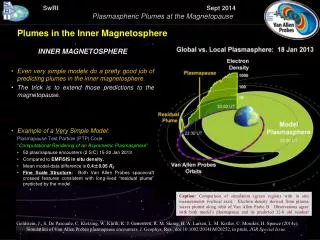
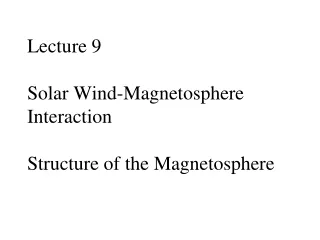
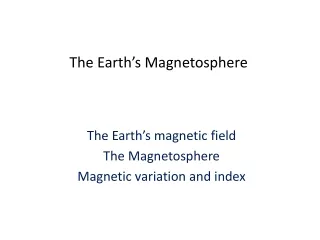
Turbulence in the magnetosphere (Goldstein 2005) • Energy transfer from large scales to kinetic scales ? • Mass and momentum transfer from one region of the magnetosphere to another
Turbulence in the cusp region • Cluster spacecraft allow to distinguish between temporal and spatial fluctuations • Nykyri et al. (2004) : using magnetometer data from Cluster, they find evidence that the cusp contains magnetic turbulence. • Sundkvist et al. (2005) : discovery of short-scale vortices in the cusp region another channel to transport plasma particles and energy through the magnetospheric boundary layers.
CLUSTER data • Outbound pass on February 26, 2001 [3:30:00 – 7:00:00 UT] • High resolution Magnetic Field (MF) data from the FGM magnetometer : 8 samples/sec for [3:30:00 – 5:30:00 UT] and 3 samples/sec for [5:30:00 – 7:00:00 UT] • A background MF (IGRF + external Tsyganenko 2001) has been subtracted from the data before analyzing the fluctuations. • Three distinct regions along the spacecraft trajectory are considered
CLUSTER data Densities from the WHISPER experiment Inner magnetosphere Cusp and crossings regions Magnetosheath
How can we detect/quantify intermittency ? • Probability distribution functions (PDFs) • Flatness • Multi-fractal analysis • Continuous Wavelet Transform
Probability density functions (PDFs) • PDF = histogram of the fluctuating field P(t) P(t,) = P(t+) – P(t) for a given value of the temporal scale. ( P=Bx,By,Bz or B2 ) • is the time that separates two observations of a fluctuating component : = t . 2n where t is the time resolution of the data. • Intermittency is associated with increasing departure of PDFs from gaussianity when the scale decreases. • Number of points << than in SW data statistics is good only up to ~ 5
PDFs in the inner magnetosphere Non-scaled PDFs B2 Scaled PDFs
PDFs in the cusp region B2 Non-scaled PDFs Scaled PDFs
PDFs in the magnetosheath B2 Non-scaled PDFs Scaled PDFs
FLATNESS • The flatness F is related to higher moments of the fluctuations : F =<P(t,)4> / (<P(t,)2>)2 < > = mean on all data considered • A fluctuating parameter is intermittent if F increases when considering smaller scales • If F remains more or less constant whatever the scale, the fluctuations are self-similar • F = 3 for Gaussian fluctuations
CORRELATION COEFFICIENTS = cross correlation coefficient between Pi and Pj for the time-lag Auto-correlation when i = j • The Magnetic Field will be correlated with itself within a turbulent eddy and uncorrelated outside the eddy. • The value of for which the auto-correlation coefficient = 1/e gives the temporal scale size of the eddy. The length of the eddy can then be deduced from the flow speed of the plasma
CORRELATION COEFFICIENTS • Cluster 1 & 4 • Comp. Bz • Complete data Dynamic nature of the turbulent eddies
COMPARISON MACRO/MICRO-SCALES CLUSTER 1 & 4
CONCLUSIONS & PERSPECTIVES • PDFs : gaussian in the inner magnetosphere, non-gaussian in the cusp and magnetosheath • Flatness : F takes values close to 3 in the magnetosphere and strongly increases with decreasing scale in the cusp and magnetosheath region • These results suggest the presence of intermittent turbulence in the cusp and magnetosheath • Correlation analysis : existence of structures with scales comparable to the satellite separation distance. Structures with smaller scales exist as well, suggesting non self-similarity. • To test this hypotheses more quantitavely non-gaussian rescaling of the PDFs (Hnat et al. 2002) + multi-fractal analysis (investigations in progress).