Download
1 / 17
170 likes | 301 Views
Summary of Streamflow Conditions and USGS Low-Flow Activities. State Drought Task Force Meeting March 29, 2012 St Paul, MN - Webinar. James Fallon, Dave Lorenz, Greg Mitton USGS, Mounds View, MN jfallon@usgs.gov 763-783-3255. U.S. Department of the Interior

E N D
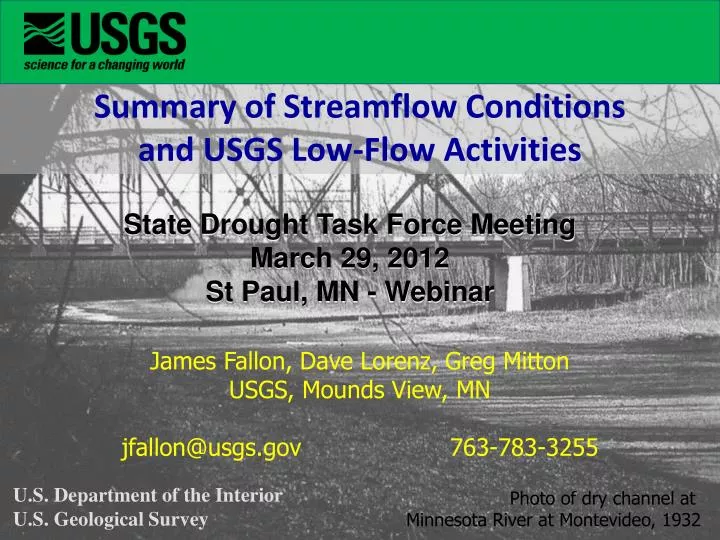
Summary of Streamflow Conditions and USGS Low-Flow Activities State Drought Task Force Meeting March 29, 2012 St Paul, MN - Webinar James Fallon, Dave Lorenz, Greg Mitton USGS, Mounds View, MN jfallon@usgs.gov 763-783-3255 U.S. Department of the Interior U.S. Geological Survey Photo of dry channel at Minnesota River at Montevideo, 1932
Topics • Summary of Streamflow Conditions • Mississippi Low-Flow Report Findings • Low-Flow Statistics & Web Resources • Low-Flow Triggered Activities • Extra low-flow measurements • Mississippi River GW Seepage Study between St Cloud and Elk River Le Sueur River near Rapidan Sept. 28, 2011 31 cfs
Summary of Streamflow Conditions • Background: snowmelt peaks are often greatest flows of year for northern 2/3’s of Minnesota • Most streams have peaked due to snowmelt • Peaks are about 1-month earlier than usual • Most peaks are smaller than normal Typically about 25th percentile Some flows extremely low but masked from season • Spring rains could change all this
Overview Much of US experiencing below-normal streamflow Northern US gages not reporting: ice-affected http://waterwatch.usgs.gov/new/index.php?id=dryw http://waterdata.usgs.gov/usa/nwis/rt
Minnesota Flow Conditions Similar First glance: flows seem normal with low flows in south & NE Look closer at hydrographs with respect to season and timing http://waterdata.usgs.gov/mn/nwis/current/?type=intro
Flow-Duration Hydrographs from Selected Streamgages Basswood8 7Pigeon 5Kawishiwi 7Prairie Red-Fargo8 7Buffalo 7 Miss-B 71. Snake current 7 Miss-Anoka Crow8 MN-Monte8 7MN-Jordan LeSueur8 7Straight 7DesMoines WaterWatch Duration Hydrographs http://waterwatch.usgs.gov/new/index.php Current Streamflow Conditions http://waterdata.usgs.gov/mn/nwis/current/?type=flow
So what do these low-flow conditions look like? Mississippi River Low Flow Report “Normal” snowmelt runoff peak at Le Sueur River near Rapidan, March 23, 2007. Measured 3,260 cfs after peak (trees on left bank).
Mississippi River Low Flow Report Cobble Riffle Same view of channel last fall. September 28, 2011. 33 cfs
Flow this spring: March 7, 2012. Just past snowmelt runoff peak. Peak was <1,000 cfs (about 1.5 ft higher than shown in picture). View looking upstream of same cobble riffle.
Low-Flow Characteristics of the Mississippi River Research supported by the Met Council (2008) Dave Lorenz and Erich KesslerUSGS Minnesota Water Science Center http://pubs.usgs.gov/sir/2010/5163/
Study Objective and Approaches Characterize the regional low flows in the Mississippi River upstream of Minneapolis. Part 1. Review low-flow duration statistics for the Miss. R. near Anoka, one upstream site (Grand Rapids), and three tributaries (Crow R., Crow Wing R., and Rum R.) as well as the headwaters reservoirs. Part 2. Construct a very large sample of potential flows, by superpositioning observed summer flows on observed snowmelt flows.
Implications, Part 1 • The greatest threat from low flows occurs when the Mississippi River near Anoka and the upstream basins experience low flows. • The assumption that droughts and corresponding low flows are widespread is not necessarily true. There are several instances of low flows in one or two basins and not in the other basins. • In general, the headwaters reservoirs are at or below their summer operating range during lowest flows in the Mississippi River.
Implications, Part 2 The greatest threat from the lowest flows occurs before the end of June when a dry spring follows a snowmelt peak of less than 11,300 cubic feet per second.
Low-Flow Triggered Activities • Discharge measurements at low-flow sites • Mississippi River Groundwater Seepage Synoptic Measurements
Additional Drought Resources Drought-related Web Page Low-Flow Statistics Web Page http://mn.water.usgs.gov/drought/ http://mn.water.usgs.gov/infodata/lowflow/
Questions? • Snowmelt peaks are often greatest flows of year for northern 2/3’s of Minnesota • Most streams have peaked due to snowmelt • Peaks are about 1-month earlier than usual • Most peaks are smaller than normal Typically about 25th percentile Some flows extremely low but masked from season • Many conditions in Upper Mississippi Basin “right” for severe low flow in Metro • Spring rains could change all this