Download
1 / 22
220 likes | 370 Views
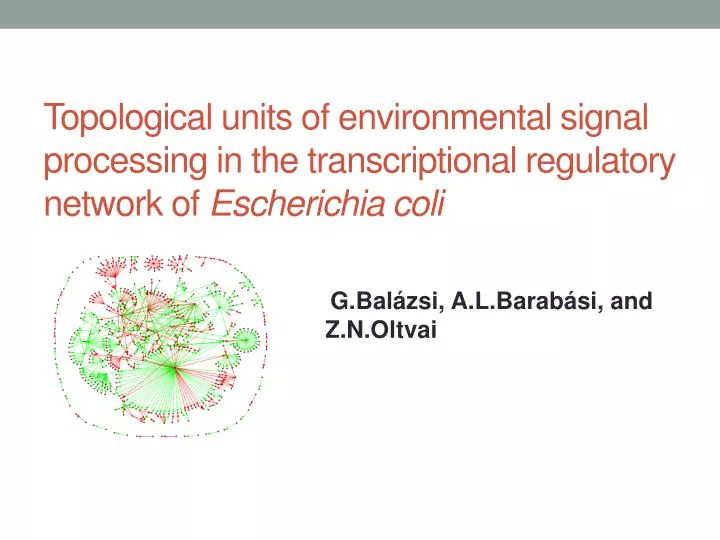
Topological units of environmental signal processing in the transcriptional regulatory network of Escherichia coli. G.Balázsi, A.L.Barabási, and Z.N.Oltvai. Central Dogma. The DNA is segmented into genes, where each gene encodes a protein The central dogma of biology –is a two step process

E N D
Topological units of environmental signal processing in the transcriptional regulatory network of Escherichia coli G.Balázsi, A.L.Barabási, and Z.N.Oltvai
Central Dogma • The DNA is segmented into genes, where each gene encodes a protein • The central dogma of biology –is a two step process • The interesting thing here is the feedback – proteins that are produced from DNA can influence the transcription rate of other proteins – Transcription factors
Gene Regulation Example of Gene regulation: Lac operon
Microarrays • Technique to detect the gene expression • Two complementary DNA strand “Hybridize” (find its match), signal is emitted to denote its expression • DNA attached to solid support(glass, plastic) • RNA is labeled– “Target”. Bound DNA is the “probe”
Z-score and Normalization • Normalization: Adjusting values measured on different scales to a common scale • Take any two number : x = {2,6} • Calculate mean and standard deviation Convert the population to z-score • Recalculate mean and standard deviation
Cell and environmental cues • Cells react to environmental cues/factors • Reaction are normally Regulatory • Each reaction is highly interconnected forming a Regulatory Network. • E. Coli – 1000 protein types at any given moment >4000 genes (or possible protein types) – need regulatory mechanism to select the active set • We are interested in the design principles of this network
Questions raised and claims proposed • Extensive studies about the TR Networks- But are we missing extracellular environmental factors? -Topological units of environmental signal processing called ORIGONS are present at the root nodes as sensor’s specialized for their detection • How do they react when complex environmental signals are subjected? -They brake down to elementary components and develop response by reassembling near the output layer
X Y The E.coli Regulatory Network • Nodes are proteins (or the genes that encode them) • Edges represent regulatory relation between two proteins
Real vs Random Networks • Patterns that occur in the real network are much more complex than in a randomized network, and have functional significance. • The randomized networks share the same number of edges and number of nodes, but edges are assigned at random
13 3-node circuits Methods-Analysis of the Networks • Find n-node sub-graphs in real graph. • Find all n-node sub-graphs in a set of randomized graphs with the same distribution of incoming and outgoing arrows. Assign Z-score for each sub-graph. • Sub-graphs with high Z-scores are denoted as Network Motifs. (Newman, 2000, Sneppen, Malsov 2002)
Correlation and Covariance Node-Node Correlation Node – Signal Covariance Sc - signal Node signal covariance between node i and signal for all the genes belonging to operon I LRr,c - Log ratios of row (Genes of operon1) LRr’ ,c - Log ratios of row (Genes ofoperon2) i,j- operons, Standard deviation from row r
Double Z score and Hypothesis Testing Ho – Origons are Significantly affected by the external signal Ha – They are not affected at all Test Statistic: z Test For nodes within the network, Where, (cov)ns for all n- nodes =1,2… µNs and are mean and std deviation of For nodes affected by external signals, Where, µo = (zNs)o over all No nodes of Origon and µR and are mean and std deviation for No nodes in the Randomized graph. Based on the Z score, the Null/Alternate Hypothesis is accepted or Rejected.
Results – Regulatory interaction + Sub networks • Based on the studies, 76 input nodes (sensor TF’s) and 312 output nodes(non TF proteins) were assigned • Topological units can be differentiated into operon from layer 0 (input layer)and sensory inputs (TF’s with environment dependent activity) • Thus, these sub networks directly or indirectly regulate upon an environmental signal- Regulation
Results: Single and complex signals • Single signal affects the activity of expression level of single sensor TF • For Complex signal, signal processing takes place via isolated origon (25 origons) and hence signal re-combination of connected origons ( 6 origons of 3 2-node ) • The feed forward loop is a filter for transient signals while allowing fast shutdown
Results: Intracellular Node correlation • Given two nodes, measure the deviation of their correlation from correlation of randomly chosen nodes. • From the Z values for non- specific perturbation, both in the fnr and crp region , there is no significant changes • Obvious significance for FNR- specific
Results: Motifs and Sub graphs occupy distinct position in the Origon • Signal percolates from top to bottom altering the Gene expression (SRI- Single regulatory Interactions; DIV-divergence; CNV- convergence; CAS- Cascade; FFL- Feed Forward) • The three node network is picked and relative abundance was found • FFL graphs were significantly more • Majority of Origons were Trees • They contained DIV and CAS sub graphs • CNV was absent from origons(combine perturbation during propagation • SRI are low pass filter
SRI network and Mechanism • SRI has a simple mechanism • Based on the time- course of the output protein levels after periodic perturbation, the relative abundance of the sub graphs were estimated
Summary • ORIGONS are responsible for Environmental perturbation Processing • Origons are rooted at the TF’s, sensitive to the signal • Based on complexity, Environmental perturbations can be elementary(Change of a single factor on constant environment) or complex(simultaneous changes of two or more factors) • ORIGONS concept suggest that Transcriptional regulatory level cells perceive the environmental signal by first breaking down it into elementary perturbation by individual origons, followed by reassembling these origons near output • Given idea about Dimensionality Reduction and Singular Value Decomposition , while dealing with large complex data.