Download
1 / 62
620 likes | 745 Views
Transcription Networks And The Cell’s Functional Organization. Presenter: Roni Sharf. Topics to be discussed. Introduction Transcription Networks Appendix C Albert-Laszlo Barabasi & Zoltan N.Oltvai Article Conclusions. Introduction and basic concepts. What is a cell?

E N D
Transcription Networks And The Cell’s Functional Organization Presenter: RoniSharf
Topics to be discussed • Introduction • Transcription Networks • Appendix C • Albert-Laszlo Barabasi & ZoltanN.Oltvai Article • Conclusions
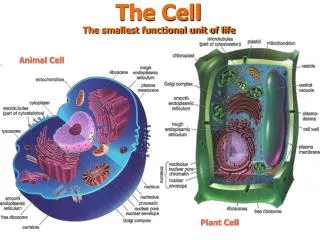
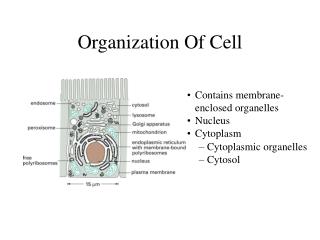
Introduction and basic concepts What is a cell? The cell is an integrated device that is made of several thousand types of interacting proteins. A protein is a nanometer size molecular machine that carries out a specific task with exquisite precision. A cell knows how to monitor its environment and to calculate the amount of proteins and which types are needed in order to carry out a specific task.
Introduction and basic concepts (cont.) for example: when a sugar is sensed by the cell, the cell begins to produce proteins that will transport the sugar into the cell and benefit from it. another exmaple is when the cell is damaged, it produces the needed amount of repair proteins to fix it. The “tool” that helps the cell to determine what proteins are needed and at which rate, an information-processing function is carried out by transcription networks.
The cognitive problem of the cell Cells, being very complex, can sense many different signals, such as beneficial nutrients, harmful chemicals, temperature, biological signaling molecules from other cells and more. The response to these signals is presented by producing appropriate proteins that can address the given situation. In order to represent these environmental states , the cell uses special proteins called transcription factors.
The cognitive problem of the cell (cont.) Each active transcription factor can bind the DNA to regulate the rate at which specific target genes are read. The genes are read into mRNA, which is then translated into protein, which can act on the environment. Their activity in the cell is considered an internal representation of the environment. The most important internal representations are of cell survival and growth. Of course there are others as well that represent the cell “starvation” or the damage of the DNA. In each case the appropriate protein response is carried out.
Elements of transcription networks The interaction between transcription factors and genes is described by transcription networks. Each gene is a stretch of DNA whose sequence encodes the information needed for production of the protein.
Elements of transcription networks (cont.) Transcription of a gene is the process by which RNA polymerase (in short RNAp) produces mRNA that corresponds to that gene’s coding sequence. The mRNA is then translated into a protein, that is also known as the gene product. The rate at which the gene is transcribed, the number of mRNA produced per unit time, is controlled by a regulatory region of DNA, known as the promoter, that preceds the gene.
Elements of transcription networks (cont.) Whereas RNAp acts on virtually all of the genes, changes in the expression of specific genes are due to transcription factors. Each transcription factor modulates thetranscription rate of a set of target genes. Transcription factors bind specific sites in the promoters of the regulated genes, thus affecting the transcription rate. When bound, they change the probability per unit time that RNAp binds the promoter and produces an mRNA molecule.
Elements of transcription networks (cont.) The transcription factors thus affect the rate at which RNAp initiates transcription of the gene. Transcription factors can act as activators, that increase the transcription rate of the gene Y Y Y Y Increased transcription Gene Y Bound activator
Elements of transcription networks (cont.) Transcription factors can act as repressors, that reduce the transcription rate of the gene No transcription Bound repressor
Elements of transcription networks (cont.) Transcription factor proteins are themselves encoded by genes, which are regulated by other transcription factors, which in turn may be regulated by other transcription factors, and so on. This set of interactions forms a transcriptionnetwork. Transcription network describes all of the regulatory transcription interactions in a cell. In the network, the nodesare genes and edgesrepresent transcriptional regulation of one gene by the protein product of another gene.
Elements of transcription networks (cont.) Edge means that the product of gene X is a transcription factor protein that binds the promoter of gene Y to control the rate at which gene Y is transcribed. The inputs to the network are signalsthat carry information from the environment. For example, signal can cause X to rapidly shift to its active state , bind the promoter of gene Y, and increase the rate of transcription, leading to increased production of protein Y, as whas shown before.
Elements of transcription networks (cont.) A transcription network that represents about 20% of the transcription interactions in the bacterium E.coli. return
Properties of a transcription network graph Each edge in a transcription network corresponds to an interaction in which a transcription factor directly controls the transcription rate of a gene. These interactions can be of two types: • Activation (positive control) – occurs when a transcription factor increases the rate of transcription when it binds the promoter. The sign on the edge is “+”. • Repression (negative control) – occurs when a transcription factor reduces the rate of transcription when it binds the promoter. The sign on the edge is “-”.
Properties of a transcription network graph (cont.) Transcription factors act primarily as either activators or repressors. Nodes that send out edges with mostly “-” signs represent repressors. Activators send out mostly “+” signs. But there can be some target genes for which the Activators act as repressors and vice versa.
Properties of a transcription network graph (cont.) The edges have also numbers that correspond to the strength of the interaction. The strength of the effect of a transcription factor on the transcription rate of its target gene is described by an input function. When X regulates Y, () the number of molecules of protein Y produced per unit time is a function of the concentration of X in its active form, .
Properties of a transcription network graph (cont.) Rate of production of Y = f(). The function is monotonic. It is an increasing function when X is an activator and a decreasing function when X is a repressor. A useful function that describes many real gene input functions is called the Hill function.
Properties of a transcription network graph (cont.) Hill function for activator: • n – Hill coefficient • K – activation coefficient • – maximal expression level Y promoter activity Activator concentration
Properties of a transcription network graph (cont.) Hill function for repressor: • n – Hill coefficient • K – activation coefficient • – maximal expression level Y promoter activity Repressor concentration
APPENDIX C Transcription Networks are sparse Let us look on a network with N nodes. Each node can have an outgoing edge to each N-1 other nodes. Each node can also have a self-edge.
(Cont.) What is the maximal number of the edges in a network with N nodes? Where the first sum represents the total number of self-edges, and the second sum represent the total number of outgoing edges from all the nodes.
(Cont.) A maximally connected network has a pair of edges in both directions between every two nodes. (since the network is a directed graph). The number of edges actually found in transcription networks, E, is much smaller than the maximum number of edges, . We find that the networks are sparse: . Typically, less that 0.1% of possible edges are found in the network.
(Cont.) Transcription networks are the product of evolutionary selection. Losing an edge in the network is very easy. A single mutation in the binding site of X in the promoter of Y can cause the loss of interaction! Therefore, every edge in the network is under evolutionary selection. The sparse nature of the network reflects the fact that only very few and specific interactions, with usuful functions, appear in the network.
Long-Tailed output degree and Compact input degree sequences Basic concepts: The number of edges that point into a node is called the node’s in-degree: The out-degree is the number of edges pointing out of a node. in-degree = 4 out-degree = 3
(Cont.) • Incoming edges to a node correspond to transcription factors that regulate the gene. • Outgoing edges correspond to the number of genes regulated by the transcription factor protein that is encoded by the gene, that corresponds to the node.
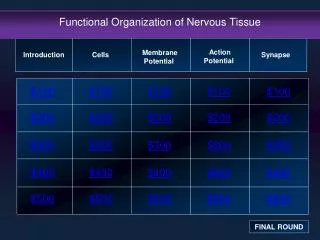
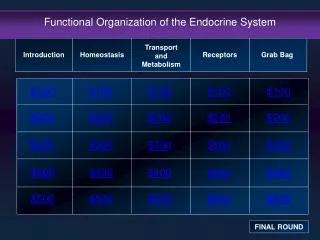
(Cont.) We deifne the mean number of edges per node, also called the mean connectivity of the network by: . Typically is on the order of 2 to 10 edges/nodes. One of the qualities that are common in the transcription networks is that they have nodes that show much higher out-degrees than the average node. example
(Cont.) That shows that not all the nodes have similar degrees! Transcription networks often have many transcription factors that regulate a few genes, fewer nodes that regulate tens of genes, and even fewer nodes that regulate hundreds of genes. The latter are called global regulators, and they usually respond to key environmental signals to control large ensembles of genes.
(Cont.) Thus, the out-degree distribution has a long tail and can be roughly described as a power law. The out-degree distribution is only approximately power law. It is bounded by the total number of genes N. The long-tailed distribution is sometimes called “scale-free” because there are sets of regulated genes of many different sizes with no typical scale. Nodes with many more connections than the average are called hubs.
(Cont.) In contrast to the long-tail of the out-degree distribution, the in-degree distribution is concentrated around its average value. The in-degrees range between zero and a few times the mean connectivity, . There is a very little chance to find a node regulated by 10 or 100 times more inputs than the average node. In other words, The in-degree distribution does not have a long-tail, but instead resembles compact distributions, such as the Poisson distribution, whose standard deviation is about the same as the mean.
Cluster coefficients of transcription networks An additional statistical property of graphs is the clustering coefficient, which corresponds whether the neighbors of a given node are connected to each other. We will consider the network as nondirected. A node with k neighbors can be part of at most triangles, that is one for each possible pair of neighboring nodes.
Cont. The clustering coefficient C is the average number of triangles that a node participates in, divided by this maximal number (). Transcription networks have average clustering coefficients larger than those of randomized networks.
Cont. The clustering coefficient can also be measured as a function of the number of neighbors that each node has, resulting in a clustering sequence C(k). Often C(k) ~ 1/k. The more neighbors a node has, the lower its clustering coefficient.
Undertanding The Cell’s Functional Organization Albert-Laszlo Barabasi & ZoltanN.Oltvai “A key aim of postgenomic biomedical research is to systematically catalogue all molecules and their interactions within a living cell.”
Introduction Reductionism has dominated the biological research over a century, and provided a wealth of knowledge about individual cellular components and their functions. Nowadays, it is increasingly clear that a discrete biological function can only rarely be attributed to an individual molecule.
Introduction (cont.) Most biological characteristics arise from complex interactions between the cell’s numerous constituents, such as proteins, DNA, RNA and more. Therefore, the main focus in the 21st century is to understand the structure and the dynamics of the complex intercellular web of interactions that contribute to the structure and function of a living cell.
Introduction (cont.) In order to do so, scientists developed new technology platforms, such as protein chips or semi-automated Yeast-Two Hybrid Screens, that help determine how and when these molecules interact with each other. Protein chips P-type ATPases interact with TcPKAr Yeast-Two Hybrid Screen
Introduction (cont.) Contemporary biology’ s major challenge is to map out, undestand and model in quantifiable terms the topological and dynamic properties of the various networks that control the behavior of the cell.
Basic network nomenclature The behaviour of most complex systems, such as the cell, emerges from the activity of many components that interact with each other through pairwise interactions. At a highly abstract level, we can consider the components as series of nodes that are connected to each other by links (edges). The nodes and links together form a network (or a graph).
A graph theoretic description for a simple pathway (catalysed by Mg2+-dependant Enzymes *As we can see, the graph is directed An example: In the most abstract approach, all interacting metabolites are considered equally *As we can see, the graph is undirected
the degree distribution, P(k) of the metabolic network illustrates its scale-free topology *As we can see, the greater the degree, the smaller the distribution The scaling of the clustering coefficient C(k) with the degree k illustrates the hierarchical architecture of metabolism *As we can see, the greater the degree, the smaller C(k)
Yeast protein interaction network.A map of protein–protein interactions, which is based on early yeast two-hybrid measurements, illustrates that a few highly connected nodes (which are also known as hubs) hold the network together. The largest cluster, which contains ~78% of all proteins, is shown. The colour of a node indicates the phenotypic effect of removing the corresponding protein (red = lethal, green = non-lethal, orange = slow growth, yellow = unknown)
Architectural features of cellular networks A series of recent findings indicate that the random network model (a model that implies that the nodes degrees follow the Poisson distribution, meaning that most nodes have the same number of links approximately equal to the network’s average degree <k>, where k represents the degree of a given node) cannot explain the topological properties of real networks. The finding was that for many social and technological networks the number of nodes with a given degree follows a power law. (the probability that a chosen node has exactly k links follows , where γ is the degree exponent, with its value for most networks being between 2 and 3.
Networks that are characterized by a power law degree distribution are highly non-uniform, most of the nodes have only a few links. A few nodes with a very large number of links, which are often called hubs, hold these nodes together. Networks with a power degree distribution are called scale-free. It indicates the absence of a typical node in the network (one that could be used to characterize the rest of the nodes). However, scale-free networks could easily be called scale-rich as well, as their main feature is the coexistence of nodes of widely different degrees (scales), from nodes with one or two links to major hubs.
Cellular networks are scale-free An important development in understanding of the cellular network architecture was the finding that most networks within the cell approximate a scale-free topology. The first evidence came from the analysis of metabolism, in which the nodes are metabolites and the links represent enzyme-catalysed biochemical reactions. As many of the reactions are irreversible, metabolic networks are directed. So, for each metabolite an ‘in’ and an ‘out’ degree can be assigned that denotes the number of reactions that produce or consume it, respectively.
An example of a random network where all the nodes are connected. The network is undirected The distribution of the degrees of the nodes according to Poisson distribution The clustering coefficient is independent of the node’s degree in a random network
An example of a scale-free network where all the nodes are connected. The network is undirected The distribution of the degrees of the nodes according to the power-law The clustering coefficient is independent of the node’s degree in this example