Download
1 / 27
270 likes | 298 Views
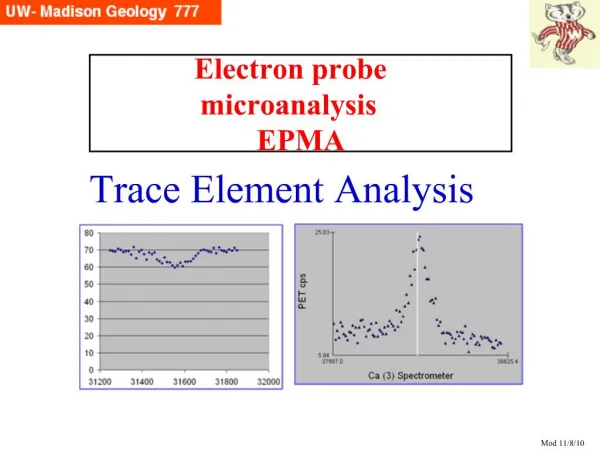
Electron probe microanalysis EPMA. Light Element Analysis. What’s the point?. What are the problems analyzing light elements? How precise/accurate are such analyses?. Element. Z. Wavelength Å. Energy (eV). Edge (eV). Be. 4. 114. 109. 112. B. 5. 67.6. 183. 192. C. 6. 44.7.

E N D
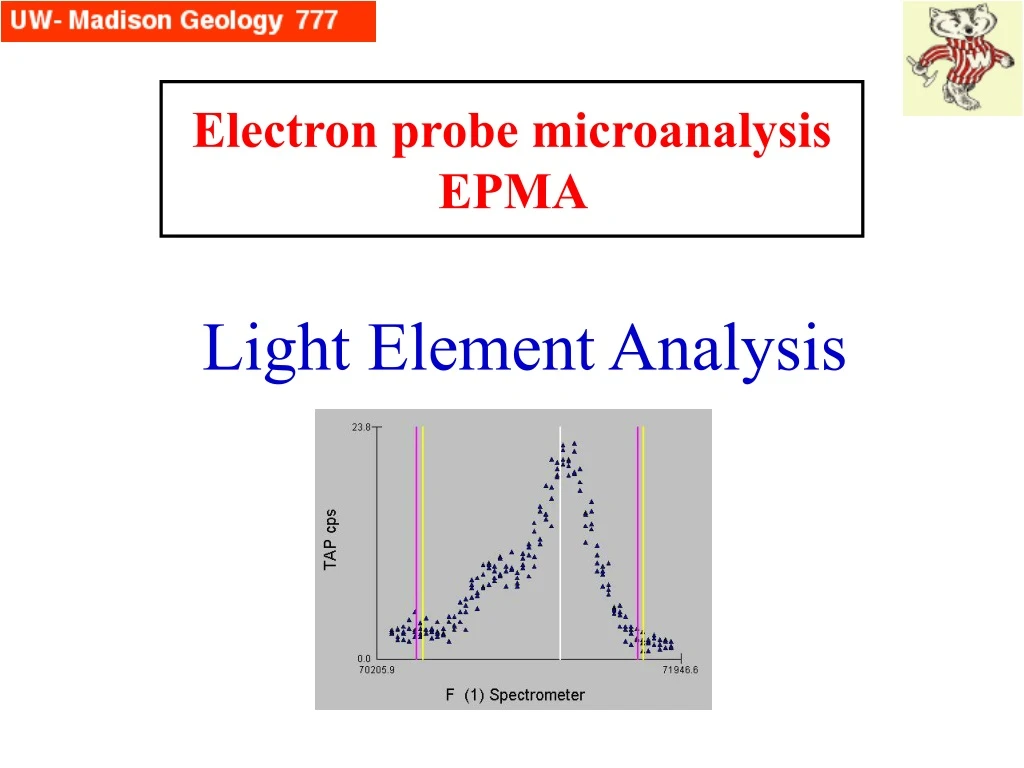
Electron probe microanalysisEPMA Light Element Analysis
What’s the point? What are the problems analyzing light elements? How precise/accurate are such analyses?
Element Z Wavelength Å Energy (eV) Edge (eV) Be 4 114 109 112 B 5 67.6 183 192 C 6 44.7 277 284 N 7 31.6 292 400 O 8 23.6 525 532 F 9 18.3 677 687 Which Elements? Ka X-ray Data We are concerned here primarily about the K lines of elements Be-F, although many of the concerns affecting their analysis is also true for L and M lines of heavier elements that fall in this low wavelength (low energy) realm.
Issues for Low eV X-rays • Decreased X-ray generation (low fluorescence yields) • Absorption of these weak X-rays by matrix • Interferences by L and M lines of higher Z elements, as well as higher order lines • Wavelength shifts and changes in shape of peaks, due to chemical effects (e.g., valence electrons involved in X-ray generation), and sometimes crystallographic orientation (polarization) • Possible errors in matrix correction due to poorly known values especially of m.a.c.s • Low E0 operation beneficial (decreased range, thus decreased path length), but then coating and thin film effects magnified
Long Wavelength Spectrometry • TAP and stearate crystals, or the newer layered synthetic (“pseudo crystals”) are two options. Each category has positive and negative features: • TAP and stearate: better spectral resolution (avoid interferences), but peak shape differences accentuated and there are lower count rates; stearates somewhat less stable. • LSMs: poorer spectral resolution (interferences unavoidable), higher orders suppressed, and there are much higher count rates.
Fluorescence Yields The yields of K lines of B-F are <0.05, as well as the L and M lines of the higher Z elements that fall below 1 keV (longer than 12 Å).
Absorption • X-rays with low energies (e.g. < 1 keV) have increased problems with absorption: • within the sample and standard (compare emitted from generated C Ka in B4C matrix, Fig. 1) • by any intentional (e.g. C-coat) or unintentional (contamination, oxidized) thin film or coating on sample and standard • by windows or diffracting crystal (though these are the same for both standard and sample and thus ‘cancel out’) Fig 1: from Bastin and Heijligers, 1992, Present and future of light element analysis with electron beam instruments. Microbeam Analysis, 1, 61-73.
M.A.C.s An additional complication is that many mass absorption coefficients for use with light elements are not known with great accuracy, as shown in the adjacent table of m.a.c.s for O Ka X-rays, which show the ‘best’ determinations by Bastin and Heijligers (1992), two pre-eminent researchers in this field. Bastin and Heijligers, 1992, Present and future of light element analysis with electron beam instruments. Microbeam Analysis, 1, 61-73.
Peak Shifts and Shapes Here the Fe La and Lb peak shapes and intensities are functions of the bonding (valence states). Attempts have been made to utilize this for determining valences of Fe and Mn compounds; results are complicated. The electrons involved with the transitions yielding the C ka X-ray are valence electrons. Differences in bonding are reflected in differences in the shapes of the peaks (including shifts of the maxima). (From Meeker and Lowers, Standards for the analysis of geological and ceramic materials, Slide 813, NIST-MAS Workshop, April 2002.) Fig 18.1, from Reed 1993, p. 275
Deconvolution of F peaks This pair of figures provides some explanation why these low energy peaks behave as they do, by deconvolution into the (apparent) related peaks that the spectrometer does not have enough resolution to separate out. Fluorite (left) and F-topaz (right). Fig 4, Fialin et, 1994, Microbeam Analysis
Measuring Light Elements: peaks or integrals? The previous slide demonstrates a complication for light element analysis: a simple measurement of intensity at the nominal (=standard’s) peak position, may result in an incorrect quantitative analysis. Clearly, the whole area under the peak is the true representation of the X-ray’s intensity. However, to measure the whole area (the integral) is a time-consuming task — particularly as you must measure from the peak maximum to minimum, and the count rate on the latter is low, so to achieve high precision, the count must be repeated many times. One does not want to do it very often. A time-saving alternative procedure is to first spend some time acquiring both peak counts and integrals (=wave scans) of the standard and each typical phase. A mathematical ratio, the area peak factor, APF, is then calculated which can then be invoked within the matrix correction. Then, for each unknown, only the peak (and background) needs to be measured.
Area Peak Factors If APFs are to be used, that option can easily be turned on in the Analytical Options menu at the very top of the PfW window. Prior to that, either APFs determined for element pairs (left) or for a specified phase (under Elements/Cations) must be determined and entered into the run.
APF compilations Bastin and Heijligers, 1992, Present and future of light element analysis with electron beam instruments. Microbeam Analysis, 1, 61-73.
Crystal types and peak shapes In many cases,the synthetic crystals are ‘better’ than conventional stearate crystals: the count rates are much greater (compare top 2 spectra). And the synthetics greatly dampen out the higher order reflections (compare higher order Nd reflections, bottom left vs right). Bastin and Heijligers, 1992, Present and future of light element analysis with electron beam instruments. Microbeam Analysis, 1, 61-73.
Crystal types and peak shapes In many cases,the synthetic crystals are ‘better’ than conventional stearate crystals: the count rates are much greater (compare top 2 spectra). And the synthetics greatly dampen out the higher order reflections (compare higher order Nd reflections, bottom left vs right). 5 Nb La 28.6 A 5 Nb Ln 31.1 A 5 Nb LL 32.6 A 6 Nb La 34.3 Nb La n=5 Nb Ln n=5 Nb LL n=5 Nb La n=6 Bastin and Heijligers, 1992, Present and future of light element analysis with electron beam instruments. Microbeam Analysis, 1, 61-73.
F Ka But not always... In some cases, the ‘traditional’ crystal is preferred over the synthetic. The count rates are lower, but critical first order interferences can be avoided. One case is the measurement of F in biotite, where Fe L peaks are present (not to mention n>1 Mg, Fe and Al). In this case, I find the TAP crystal preferable.
Crystallographic effects (From Meeker and Lowers, Standards for the analysis of geological and ceramic materials, Slide 813, NIST-MAS Workshop, April 2002.)
Interferences This older listing by an EDS manufacturer of elements that fall in the “light element” region is somewhat misleading ... unintentionally, of course, as it most certainly predates the 1990s. You can see that there are some L lines that fall in the region, but there is no indication of any M lines....
Fortunately, Virtual WDS provides an indispensible service for light element analysis, by showing all the potential interferences. Green indicates first order interferences, and blue higher order ones. Interferences (as shown by Virtual WDS)-1 B C N
O Interferences (as shown by Virtual WDS)-2 Note the large number of interferences for O and F ka. This increases the difficulty of analysis of those elements. F
PHA can help Higher order peaks interferring with the long wavelength (light energy) peaks can be largely eliminated (though not 100%) by setting the PHA to differential mode and a window to cut out the higher order lines (here, 2Cr and 3Ni.) Fig 18.4, from Reed 1993, p. 278
Some (random) particular issues • Be: rarely analyzed (heavily absorbed); polarization • B: Interference by Cl L, Mo, Nb, Zr M lines; specular reflectance of Si L • C: diamond not good standard • N: interference by Ti L • O: Interference by 2Na K; just above C edge, heavily affected by carbon contamination or coat thickness • F: Interference by 3P Ka, Fe L; mobility in apatite (orientation)
3000 B Ka/10 Si L sp.ref. 2500 Mo Mz 2000 1500 Counts 1000 500 0 50 60 70 80 Wavelength (A) Boron Example of pathological interferences on B ka: Mo Mz falls very close to the peak, and the strong spectral reflectance of the Si La line greatly complicates determining the background. B-free Mo5Si3 appears to have 3.82 wt% B, or 19.7 atomic %B – a major error With PfW, we can define curved backgrounds, and subtract the interferences within the matrix correction, yielding excellent results.
Fe3O4 and Fe2O3 In “normal” geological epma, oxygen is not a critical element, and is input into the matrix correction by stoichometry. However, there are instances where oxygen cannot be defined by stoichometry, and must be explicitly determined. Nash (1992) evaluated oxygen in a variety of minerals and glasses at 15 keV, and found that the precision of O in silicate glass is 0.6% relative, comparable to that of Si. “Optimum results occur when standards similar in composition to unknowns are used and care is taken in standard and sample preparation. The procedure is particularly advantageous in the analysis of hydrous glass and minerals in which conventional microprobe analyses yield totals of less than 100% because O attached to H remains unmeasured.” Oxygen If oxygen is to analyzed, it is critical to carbon coat both standards and unknowns at the same time. Nash, 1992, Analysis of oxygen with the electron microprobe: applications to hydrated glass and minerals. American Mineralogist, 77, 453-457.
Carbon contamination Hydrocarbons in the chamber inevitably will find their way to the beam, which apparently cracks them, and a layer builds up with time. This thin layer of carbon has a strong absorption of oxygen Ka as well as other light elements.
Anti-contamination Curve A shows a time-dependent build up of carbon on a polished brass sample. Anti-contamination devices that could be used to reduce C build up include a cold finger located a few mm from the beam above the sample (b), and an air jet -- a microtube that shoots a thin stream of air at the point of beam impact on the sample surface (c: apparently oxidizes the hydrocarbon and yields a gas that is pumped away). The optimal procedure is to use both. Fig 18.4, from Reed 1993, p. 283
Other coatings Thin layers or coatings (such as oxide layers on the surface of metals like Al, Ti, Mn etc) similarly can affect X-ray production, and then absorption of X-rays in the matrix below. We will discuss “thin film” analysis shortly.