Download
1 / 17
170 likes | 262 Views
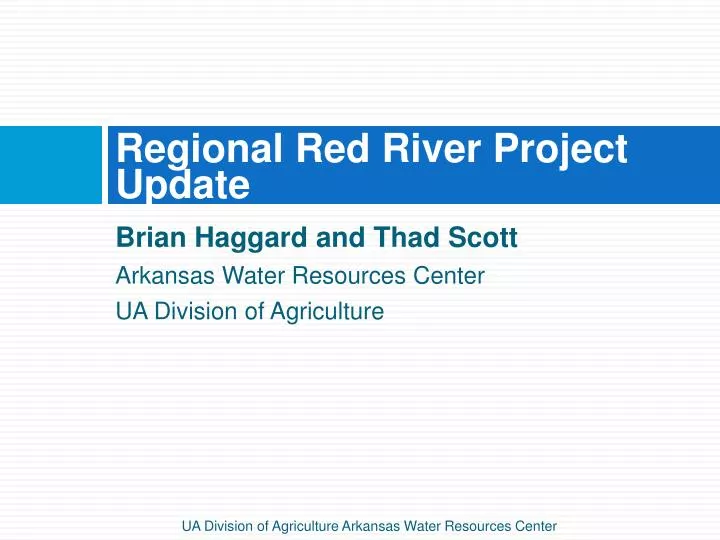
Regional Red River Project Update. Brian Haggard and Thad Scott Arkansas Water Resources Center UA Division of Agriculture. Red River Basin Regional Project. Calculating frequency distributions in the Red River Basin. Haggard & Scott 2010.

E N D
Regional Red River Project Update Brian Haggard and Thad Scott Arkansas Water Resources Center UA Division of Agriculture UA Division of Agriculture Arkansas Water Resources Center
Calculating frequency distributions in the Red River Basin Haggard & Scott 2010
First, we compared the distributions specific to the Red River to… • Number of medians above and below the recommended criteria from EPA eco-regions:
Quick look at total nitrogen… What did we find? Overall, the 25th percentiles were similar across eco-regions.
Quick look at total phosphorus… What did we find? Overall, the 25th percentiles were similar in three eco-regions. However, there was a difference in the STFPH eco-region.
Quick look at sestonic chlorophyll-a... What did we find? Well, available data specific to the Red River Basin was limited. It does look like there were some differences.
Significance of frequency distribution analysis • First piece of information for the States to consider when developing nutrient criteria • Frequency distributions for various levels: • Red River Basin (Entire) • Aggregate Level III (or, Nutrient) Eco-regions • Level III Eco-regions • Level IV Eco-regions • HUC 8 Watersheds • This probably represents the most spatially explicit frequency distributions for any large watershed.
Evaluating stressor response relationships in the Red River Basin • Regression analysis of chlorophyll-a vs. DP, NO3-N, TN, & TP • Change-point and regression tree analysis of chlorophyll-a vs. a suite of water chemistry variables • Compare and contrast percentile and stressor response results
Nutrient versus chl-a regressions – All medians REGRESSION STATISTICS – ALL DATA
Nutrient versus chl-a regressions – “Qualifier” medians (sites with n ≥ 4) REGRESSION STATISTICS – “QUALIFIER”
Changepoint analysis – Sestonicchl-a The change point analysis showed that variability in chlorophyll-a concentrations significantly changed as a function of nitrogenand phosphorus concentrations, as well as conductivity. EXAMPLE OF CHANGE POINT ANALYSIS r2= 0.24 ≥ 0.135 < 0.135 This split leads into the regression tree analysis, showing hierarchical structure.
The regression tree shows the hierarchical structure hidden in the data
What do all the statistics tell us? SUMMARY Percentiles (25th) do not match up with numbers from sestonicchl-a change points in variation or thresholds like (10 mg chl-a L-1). • Total Phosphorus 0.02 – 0.07 mg L-1, 25th Percentiles 0.10 – 0.22 mg L-1, If Y = 10 mg chl-a L-1 0.14 mg L-1, CPA and Regression Tree • Total Nitrogen 0.21 – 0.86 mg L-1, 25th Percentiles 0.87 – 2.61 mg L-1, If Y = 10 mg chl-a L-1 0.75 mg L-1, CPA and Regression Tree
Regional Red River Project Update QUESTIONS?