Download
1 / 39
390 likes | 530 Views
Biological Sequences and Hidden Markov Models CBPS7711 Sept 9, 2010. Sonia Leach, PhD Assistant Professor Center for Genes, Environment, and Health National Jewish Health sonia.leach@gmail.com.

E N D
Biological Sequences and Hidden Markov ModelsCBPS7711Sept 9, 2010 Sonia Leach, PhD Assistant Professor Center for Genes, Environment, and Health National Jewish Health sonia.leach@gmail.com Slides created from David Pollock’s slides from last year 7711 and current reading list from CBPS711 website Center for Genes, Environment, and Health
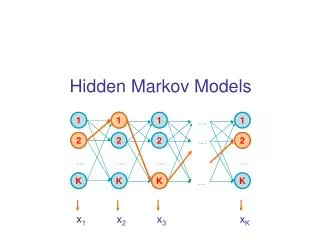
Introduction • Despite complex 3-D structure, biological molecules have primary linear sequence (DNA, RNA, protein) or have linear sequence of features (CpG islands, models of exons, introns, regulatory regions, genes) • Hidden Markov Models (HMMs) are probabilistic models for processes which transition through a discrete set of states, each emitting a symbol (probabilistic finite state machine) • HMMs exhibit the ‘Markov property:’ the conditional probability distribution of future states of the process depends only upon the present state (memory-less) • Linear sequence of molecules/features ismodelled as a path through states of the HMMwhich emit the sequence of molecules/features • Actual state is hidden and observed only through output symbols Andrey Markov 1856-1922 Center for Genes, Environment, and Health
Hidden Markov Model • Finite set of N states X • Finite set of M observations O • Parameter set λ = (A, B, π) • Initial state distribution πi = Pr(X1 = i) • Transition probability aij = Pr(Xt=j | Xt-1 = i) • Emission probability bik = Pr(Ot=k | Xt = i) Example: N=3, M=2 π=(0.25, 0.55, 0.2) A= B = 1 2 3 Center for Genes, Environment, and Health
Hidden Markov Model X X Hidden Markov Model (HMM) • Finite set of N states X • Finite set of M observations O • Parameter set λ = (A, B, π) • Initial state distribution πi = Pr(X1 = i) • Transition probability aij = Pr(Xt=j | Xt-1 = i) • Emission probability bik = Pr(Ot=k | Xt = i) t-1 t O O t t-1 Example: N=3, M=2 π=(0.25, 0.55, 0.2) A= B = 1 2 3 Center for Genes, Environment, and Health
X X Hidden Markov Model (HMM) t-1 t Markov Process (MP) O O t t-1 Probabilistic Graphical Models Time Observability and Utility Observability Utility Partially Observable Markov Decision Process (POMDP) Markov Decision Process (MDP) Center for Genes, Environment, and Health
Three basic problems of HMMs • Given the observation sequence O=O1,O2,…,On, how do we compute Pr(O| λ)? • Given the observation sequence, how do we choose the corresponding state sequence X=X1,X2,…,Xn which is optimal? • How do we adjust the model parameters to maximize Pr(O| λ)? Center for Genes, Environment, and Health
Example: • πi = Pr(X1 = i) • aij = Pr(Xt=j | Xt-1 = i) • bik = Pr(Ot=k | Xt = i) • Probability of O is sum over all state sequencesPr(O|λ) = ∑all X Pr(O|X, λ) Pr(X|λ) = ∑all Xπx1 bx1o1ax1x2bx2o2 . . . axn-1xnbxnon • Efficient dynamic programming algorithm to do this: Forward algorithm (Baum and Welch) N=3, M=2 π=(0.25, 0.55, 0.2) A= B = 1 2 3 Center for Genes, Environment, and Health
A Simple HMMCpG Islands where in one state, much higher probability to be C or G 0.8 0.9 0.2 G .3C .3A .2T .2 G .1C .1A .4T .4 0.1 CpG Non-CpG From David Pollock
CpG The Forward AlgorithmProbability of a Sequence is the Sum of All Paths that Can Produce It 0.8 G .3C .3A .2T .2 G .3 Pr(G|λ) = πC bCG+ πN bNG = .5*.3 + .5*.1 For convenience, let’s drop the0.5 for now and add it in later 0.2 0.1 G .1 G .1C .1A .4T .4 G 0.9 Adapted from David Pollock’s Non-CpG
CpG The Forward AlgorithmProbability of a Sequence is the Sum of All Paths that Can Produce It 0.8 G .3C .3A .2T .2 G .3 (.3*.8+ .1*.1)*.3 =.075 For O=GC have 4 possible state sequences CC,NC, CN,NN 0.2 0.1 G .1 (.3*.2+ .1*.9)*.1 =.015 G .1C .1A .4T .4 G C 0.9 Adapted from David Pollock’s Non-CpG
CpG The Forward AlgorithmProbability of a Sequence is the Sum of All Paths that Can Produce It 0.8 G .3C .3A .2T .2 G .3 (.3*.8+ .1*.1)*.3 =.075 (.075*.8+ .015*.1)*.3 =.0185 For O=GCG have possible state sequences CCC, CCNNCC, NCN NNC, NNN CNC, CNN 0.2 0.1 G .1 (.3*.2+ .1*.9)*.1 =.015 (.075*.2+ .015*.9)*.1 =.0029 G .1C .1A .4T .4 G C G 0.9 Adapted from David Pollock’s Non-CpG
CpG The Forward AlgorithmProbability of a Sequence is the Sum of All Paths that Can Produce It 0.8 G .3C .3A .2T .2 G .3 (.3*.8+ .1*.1)*.3 =.075 (.075*.8+ .015*.1)*.3 =.0185 For O=GCG have possible state sequences CCC, CCNNCC, NCN NNC, NNN CNC, CNN 0.2 0.1 G .1 (.3*.2+ .1*.9)*.1 =.015 (.075*.2+ .015*.9)*.1 =.0029 G .1C .1A .4T .4 G C G 0.9 Adapted from David Pollock’s Non-CpG
CpG The Forward AlgorithmProbability of a Sequence is the Sum of All Paths that Can Produce It 0.8 G .3C .3A .2T .2 G .3 (.3*.8+ .1*.1)*.3 =.075 (.075*.8+ .015*.1)*.3 =.0185 (.003*.8+ .0025*.1)*.2 =.0005 (.0185*.8+.0029*.1)*.2 =.003 0.2 0.1 G .1 (.3*.2+ .1*.9)*.1 =.015 (.075*.2+ .015*.9)*.1 =.0029 (.0185*.2+.0029*.9)*.4 =.0025 (.003*.2+|.0025*.9)*.4 =.0011 G .1C .1A .4T .4 G C G A A 0.9 Adapted from David Pollock’s Non-CpG
CpG The Forward AlgorithmProbability of a Sequence is the Sum of All Paths that Can Produce It 0.8 G .3C .3A .2T .2 G .3 (.3*.8+ .1*.1)*.3 =.075 (.075*.8+ .015*.1)*.3 =.0185 (.003*.8+ .0025*.1)*.2 =.0005 (.0185*.8+.0029*.1)*.2 =.003 0.2 0.1 G .1 (.3*.2+ .1*.9)*.1 =.015 (.075*.2+ .015*.9)*.1 =.0029 (.0185*.2+.0029*.9)*.4 =.0025 (.003*.2+|.0025*.9)*.4 =.0011 G .1C .1A .4T .4 G C G A A 0.9 Problem 1: Pr(O| λ)=0.5*.0005 + 0.5*.0011= 8e-4 Non-CpG
CpG The Forward AlgorithmProbability of a Sequence is the Sum of All Paths that Can Produce It 0.8 G .3C .3A .2T .2 G .3 (.3*.8+ .1*.1)*.3 =.075 (.075*.8+ .015*.1)*.3 =.0185 (.003*.8+ .0025*.1)*.2 =.0005 (.0185*.8+.0029*.1)*.2 =.003 0.2 0.1 G .1 (.3*.2+ .1*.9)*.1 =.015 (.075*.2+ .015*.9)*.1 =.0029 (.0185*.2+.0029*.9)*.4 =.0025 (.003*.2+|.0025*.9)*.4 =.0011 G .1C .1A .4T .4 G C G A A 0.9 Problem 2: What is optimal state sequence? Non-CpG
CpG The Forward AlgorithmProbability of a Sequence is the Sum of All Paths that Can Produce It 0.8 G .3C .3A .2T .2 G .3 (.3*.8+ .1*.1)*.3 =.075 (.075*.8+ .015*.1)*.3 =.0185 (.003*.8+ .0025*.1)*.2 =.0005 (.0185*.8+.0029*.1)*.2 =.003 0.2 0.1 G .1 (.3*.2+ .1*.9)*.1 =.015 (.075*.2+ .015*.9)*.1 =.0029 (.0185*.2+.0029*.9)*.4 =.0025 (.003*.2+|.0025*.9)*.4 =.0011 G .1C .1A .4T .4 G C G A A 0.9 Adapted from David Pollock’s Non-CpG
CpG The Viterbi AlgorithmMost Likely Path (use max instead of sum) 0.8 G .3C .3A .2T .2 max(.072*.8, .009*.1)*.3 = .0173 max(.3*.8, .1*.1)*.3 =.072 max(.0173*.8, .0014*.1)*.2 =.0028 G .3 max(.0028*.8, .0014*.1)*.2 =.00044 0.2 0.1 max(.072*.2, .009*.9)*.1 =.0014 max(.0173*.2+.0014*.9)*.4 =.0014 max(.3*.2, .1*.9)*.1 =.009 max( .0028*.2,.0014*.9)*.4 =.0005 G .1 G .1C .1A .4T .4 G C G A A 0.9 Adapted from David Pollock’s (note error in formulas on his) Non-CpG
CpG The Viterbi AlgorithmMost Likely Path: Backtracking 0.8 G .3C .3A .2T .2 max(.072*.8, .009*.1)*.3 = .0173 max(.3*.8, .1*.1)*.3 =.072 max(.0173*.8, .0014*.1)*.2 =.0028 G .3 max(.0028*.8, .0014*.1)*.2 =.00044 0.2 0.1 max( .0028*.2,.0014*.9)*.4 =.0005 max(.072*.2, .009*.9)*.1 =.0014 max(.0173*.2+.0014*.9)*.4 =.0014 max(.3*.2, .1*.9)*.1 =.009 G .1 G .1C .1A .4T .4 G C G A A 0.9 Adapted from David Pollock’s Non-CpG
CpG Forward-backward algorithm 0.8 G .3C .3A .2T .2 G .3 (.3*.8+ .1*.1)*.3 =.075 (.075*.8+ .015*.1)*.3 =.0185 (.003*.8+ .0025*.1)*.2 =.0005 (.0185*.8+.0029*.1)*.2 =.003 0.2 0.1 G .1 (.3*.2+ .1*.9)*.1 =.015 (.075*.2+ .015*.9)*.1 =.0029 (.0185*.2+.0029*.9)*.4 =.0025 (.003*.2+|.0025*.9)*.4 =.0011 G .1C .1A .4T .4 Problem 3: How to learn model? Forward algorithm calculated Pr(O1..t,Xt=i| λ) G C G A A 0.9 Non-CpG
Parameter estimation by Baum-Welch Forward Backward Algorithm • Forward variable αt(i) =Pr(O1..t,Xt=i | λ) • Backward variable βt(i) =Pr(Ot+1..N|Xt=i, λ) Rabiner 1989
Homology HMM • Gene recognition, classify to identify distant homologs • Common Ancestral Sequence • Parameter set λ = (A, B, π), strict left-right model • Specially defined set of states: start, stop, match, insert, delete • For initial state distribution π, use ‘start’ state • For transition matrix A use global transition probabilities • For emission matrix B • Match, site-specific emission probabilities • Insert (relative to ancestor), global emission probs • Delete, emit nothing • Multiple Sequence Alignments Adapted from David Pollock’s
insert insert insert end match match start delete delete Homology HMM Adapted from David Pollock’s
insert insert insert Homology HMM Example A .1C .05D .2E .08F .01 A .04C .1D .01E .2F .02 A .2C .01D .05E .1F .06 match match match delete delete delete
Ungapped blocks Ungapped blocks where insertion states model intervening sequence between blocks Insert/delete states allowed anywhere Allow multiple domains,sequence fragments Eddy, 1998 Center for Genes, Environment, and Health
Homology HMM • Uses • Find homologs to profile HMM in database • Score sequences for match to HMM • Not always Pr(O| λ) since some areas may highly diverge • Sometimes use ‘highest scoring subsequence’ • Goal is to find homologs in database • Classify sequence using libraryof profile HMMs • Compare alternative models • Alignment of additional sequences • Structural alignment when alphabet is secondarystructure symbols so can do fold-recognition, etc Adapted from David Pollock’s
Why Hidden Markov Models for MSA? • Multiple sequence alignment as consensus • May have substitutions, not all AA are equal • Could use regular expressions but how to handle indels? • What about variable-length members of family? FOS_RAT IPTVTAISTSPDLQWLVQPTLVSSVAPSQTRAPHPYGLPTPSTGAYARAGVV 112 FOS_MOUSE IPTVTAISTSPDLQWLVQPTLVSSVAPSQTRAPHPYGLPTQSAGAYARAGMV 112 FOS_RAT IPTVTAISTSPDLQWLVQPTLVSSVAPSQTRAPHPYGLPTPS-TGAYARAGVV 112 FOS_MOUSE IPTVTAISTSPDLQWLVQPTLVSSVAPSQTRAPHPYGLPTQS-AGAYARAGMV 112 FOS_CHICK VPTVTAISTSPDLQWLVQPTLISSVAPSQNRG-HPYGVPAPAPPAAYSRPAVL 112 FOS_RAT IPTVTAISTSPDLQWLVQPTLVSSVAPSQ-------TRAPHPYGLPTPS-TGAYARAGVV 112 FOS_MOUSE IPTVTAISTSPDLQWLVQPTLVSSVAPSQ-------TRAPHPYGLPTQS-AGAYARAGMV 112 FOS_CHICK VPTVTAISTSPDLQWLVQPTLISSVAPSQ-------NRG-HPYGVPAPAPPAAYSRPAVL 112 FOSB_MOUSE VPTVTAITTSQDLQWLVQPTLISSMAQSQGQPLASQPPAVDPYDMPGTS----YSTPGLS 110 FOSB_HUMAN VPTVTAITTSQDLQWLVQPTLISSMAQSQGQPLASQPPVVDPYDMPGTS----YSTPGMS 110 Center for Genes, Environment, and Health
Why Hidden Markov Models? • Rather than consensus sequence which describes the most common amino acid per position, HMMs allow more than one amino acid to appear at each position • Rather than profiles as position specific scoring matrices (PSSM) which assign a probability to each amino acid in each position of the domain and slide fixed-length profile along a longer sequence to calculate score, HMMs model probability of variable length sequences • Rather than regular expressions which can capture variable length sequences yet specify a limited subset of amino acids per position, HMMs quantify difference among using different amino acids at each position Center for Genes, Environment, and Health
Model Comparison • Based on • For ML, take • Usually to avoid numeric error • For heuristics, “score” is • For Bayesian, calculate • Uses ‘prior’ information on parameters Adapted from David Pollock’s
Parameters, • Types of parameters • Amino acid distributions for positions (match states) • Global AA distributions for insert states • Order of match states • Transition probabilities • Phylogenetic tree topology and branch lengths • Hidden states (integrate or augment) • Wander parameter space (search) • Maximize, or move according to posterior probability (Bayes) Adapted from David Pollock’s
Expectation Maximization (EM) • Classic algorithm to fit probabilistic model parameters with unobservable states • Two Stages • Maximize • If know hidden variables (states), maximize model parameters with respect to that knowledge • Expectation • If know model parameters, find expected values of the hidden variables (states) • Works well even with e.g., Bayesian to find near-equilibrium space Adapted from David Pollock’s
Homology HMM EM • Start with heuristic MSA (e.g., ClustalW) • Maximize • Match states are residues aligned in most sequences • Amino acid frequencies observed in columns • Expectation • Realign all the sequences given model • Repeat until convergence • Problems: Local, not global optimization • Use procedures to check how it worked Adapted from David Pollock’s
Model Comparison • Determining significance depends on comparing two models (family vs non-family) • Usually null model, H0, and test model, H1 • Models are nested if H0 is a subset of H1 • If not nested • Akaike Information Criterion (AIC) [similar to empirical Bayes] or • Bayes Factor (BF) [but be careful] • Generating a null distribution of statistic • Z-factor, bootstrapping, , parametric bootstrapping, posterior predictive Adapted from David Pollock’s
Z Test Method • Database of known negative controls • E.g., non-homologous (NH) sequences • Assume NH scores • i.e., you are modeling known NH sequence scores as a normal distribution • Set appropriate significance level for multiple comparisons (more below) • Problems • Is homology certain? • Is it the appropriate null model? • Normal distribution often not a good approximation • Parameter control hard: e.g., length distribution Adapted from David Pollock’s
Bootstrapping and Parametric Models • Random sequence sampled from the same set of emission probability distributions • Same length is easy • Bootstrapping is re-sampling columns • Parametric uses estimated frequencies, may include variance, tree, etc. • More flexible, can have more complex null • Pseudocounts of global frequencies if data limit • Insertions relatively hard to model • What frequencies for insert states? Global? Adapted from David Pollock’s
Homology HMM Resources • UCSC (Haussler) • SAM: align, secondary structure predictions, HMM parameters, etc. • WUSTL/Janelia (Eddy) • Pfam: database of pre-computed HMM alignments for various proteins • HMMer: program for building HMMs Adapted from David Pollock’s
Why Hidden Markov Models? • Multiple sequence alignment as consensus • May have substitutions, not all AA are equal • Could use regular expressions but how to handle indels? • What about variable-length members of family? • (but don’t accept everything – typically introduce gap penalty) FOS_RAT IPTVTAISTSPDLQWLVQPTLVSSVAPSQTRAPHPYGLPTPSTGAYARAGVV 112 FOS_MOUSE IPTVTAISTSPDLQWLVQPTLVSSVAPSQTRAPHPYGLPTQSAGAYARAGMV 112 FOS_RAT IPTVTAISTSPDLQWLVQPTLVSSVAPSQTRAPHPYGLPTPS-TGAYARAGVV 112 FOS_MOUSE IPTVTAISTSPDLQWLVQPTLVSSVAPSQTRAPHPYGLPTQS-AGAYARAGMV 112 FOS_CHICK VPTVTAISTSPDLQWLVQPTLISSVAPSQNRG-HPYGVPAPAPPAAYSRPAVL 112 FOS_RAT IPTVTAISTSPDLQWLVQPTLVSSVAPSQ-------TRAPHPYGLPTPS-TGAYARAGVV 112 FOS_MOUSE IPTVTAISTSPDLQWLVQPTLVSSVAPSQ-------TRAPHPYGLPTQS-AGAYARAGMV 112 FOS_CHICK VPTVTAISTSPDLQWLVQPTLISSVAPSQ-------NRG-HPYGVPAPAPPAAYSRPAVL 112 FOSB_MOUSE VPTVTAITTSQDLQWLVQPTLISSMAQSQGQPLASQPPAVDPYDMPGTS----YSTPGLS 110 FOSB_HUMAN VPTVTAITTSQDLQWLVQPTLISSMAQSQGQPLASQPPVVDPYDMPGTS----YSTPGMS 110 Center for Genes, Environment, and Health
Why Hidden Markov Models? • Rather than consensus sequence which describes the most common amino acid per position, HMMs allow more than one amino acid to appear at each position • Rather than profiles as position specific scoring matrices (PSSM) which assign a probability to each amino acid in each position of the domain and slide fixed-length profile along a longer sequence to calculate score, HMMs model probability of variable length sequences • Rather than regular expressions which can capture variable length sequences yet specify a limited subset of amino acids per position, HMMs quantify difference among using different amino acids at each position Center for Genes, Environment, and Health
Acknowledgements Center for Genes, Environment, and Health