Download
1 / 18
180 likes | 288 Views
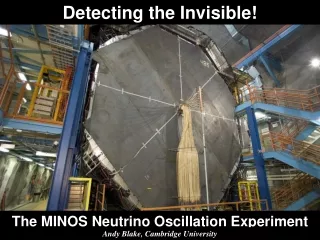
Latest Results from the MINOS Experiment. Justin Evans, University College London for the MINOS Collaboration NOW 2008 9 th September 2008. The MINOS Experiment. Measuring ν μ disappearance Near detector , 1.0 ktonne, 1km from source Far detector , 5.4 ktonne, 735 km from source

E N D
Latest Results from the MINOS Experiment Justin Evans, University College London for the MINOS Collaboration NOW 2008 9th September 2008
The MINOS Experiment Measuring νμ disappearance Near detector, 1.0 ktonne, 1km from source Far detector, 5.4 ktonne, 735 km from source Tracking, sampling calorimeters • Alternate steel and scintillator planes • Magnetised to 1.3 T Two detectors to mitigate systematics • e.g. neutrino flux or cross section mismodellings • Use measured near detector data to predict what should be observed at the far detector • An observed νμ deficit at the far detector tells us about the oscillation parameters Near detector Far detector Justin Evans
π+ Target FD p Decay Pipe ND MC MC CC νμ Beam Extrapolation Use the measured ND energy spectrum to predict the FD spectrum: Spread of pion decay directions smears neutrino energies • Different energy spectra at the two detectors Encode the pion decay kinematics into a beam transfer matrix • Convert ND to FD spectrum Justin Evans
Systematic Uncertainties Effect of uncertainties estimated by fitting systematically shifted MC in place of data Analysis is still statistically limited Three largest uncertainties included as penalty terms in fit to data • Relative (ND to FD) normalisation (4%) • Absolute hadronic energy scale (10%) • NC background (50%) Relative normalisation NC background Absolute hadronic energy Justin Evans
Far Detector Data FD data not looked at until the analysis was finalised Expected 1065 ± 60 with no oscillations Observed 848 events Energy spectrum fit with the oscillation hypothesis • Best Fit: • |m2|= 2.43x10⁻³ eV2 • sin2(2) =1.00 2/NDoF = 90/97 Justin Evans
Allowed Region Constrained fit • |m2| =(2.43±0.13)x10-3 eV2 (68% C.L.) • sin2(223) > 0.90 (90% C.L.) • 2/NDoF = 90/97 Unconstrained fit • |m2| = 2.33 x 10⁻³ eV2 • sin2(223) = 1.07 • Δ2 = -0.6 Justin Evans
Decay: V. Barger et al., PRL82:2640(1999) 2/ndof = 104/97 2 = 14 disfavored at 3.7s Decoherence: G.L. Fogli et al., PRD67:093006 (2003) 2/ndof = 123/97 2 = 33 disfavored at 5.7s Alternative Models Two alternative disappearance models are disfavoured Justin Evans
NC Event Selection Excluded Excluded Excluded Justin Evans
NC Energy Spectrum Far detector NC energy spectrum Shown at θ13= 0 and θ13 at Chooz limit Fraction of νμ which oscillate to sterile neutrinos No νe appearance • fs = 0.28+0.25-0.28 (stat.+sys.) • fs < 0.68 (90% c.l.) • With νe appearance • fs = 0.43+0.23-0.27 (stat.+sys.) • fs < 0.80 (90% c.l.) Justin Evans
νe Appearance Analysis νe spectrum is heavily background dominated • Dominant backgrounds: NC and CC νμ events Near detector shows a large discrepancy between selected and expected νe energy spectrum Using data-driven methods to correct the data/MC differences Justin Evans
νe Appearance Sensitivity With 3.25x10²⁰ protons, at the Chooz limit, we expect 12 signal and 42 background events At current exposure MINOS will reach the Chooz limit In the future MINOS can improve on the Chooz limit by a factor of ~2 (normal hierarchy) Justin Evans
Summary MINOS has made a new measurement of the atmospheric oscillation parameters • |m2| =(2.43 ± 0.13) x 10-3 eV2 (68% C.L.) • sin2(223) > 0.90 (90% c.l.) Alternative models disfavoured • Decay at 3.7σ, decoherence at 5.7σ Measurement of the NC event spectrum places a limit on oscillations to sterile neutrinos • fs < 0.68 (90% c.l.) Work is ongoing towards a νe appearance measurement • At the current exposure, MINOS’s sensitivity will rival the Chooz limit Justin Evans
Backup Slides Justin Evans
CC νμ Event Selection Aim to separate charged and neutral current νμ interactions Four variables combined using a k-nearest-neighbour algorithm • Track length • Mean signal in track planes • Transverse track profile • Signal fluctuation along the track Justin Evans
NC Energy Spectrum Far detector NC energy spectrum Shown at θ13= 0 and θ13 at Chooz limit Justin Evans
νe Appearance Analysis νe spectrum is heavily background dominated • Dominant backgrounds: NC and CC νμ events Near detector shows a large discrepancy between selected and expected νe energy spectrum Using data-driven methods to correct the data/MC differences Justin Evans
Event Topologies νμ CC Event νeCC Event NC Event UZ VZ 3.5m 1.8m 2.3m long μ track & hadronic activity at vertex short event, often diffuse short, with typical EM shower profile Eν = Eshower + pμ Monte Carlo Justin Evans