Download
1 / 43
430 likes | 587 Views
Latest Results from The MINOS Experiment. Andy Blake, Cambridge University (for the MINOS collaboration). International Conference on Topics in Astroparticle and Underground Physics . Sendai, Japan – September 2007. MINOS Physics Goals. Precision studies of n m disappearance.

E N D
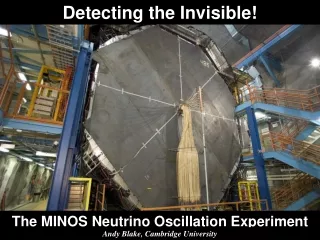
Latest Results from The MINOS Experiment Andy Blake, Cambridge University (for the MINOS collaboration) International Conference on Topics in Astroparticle and Underground Physics. Sendai, Japan – September 2007.
MINOS Physics Goals • Precision studies of nm disappearance. • – Measure m223 and sin22θ23PRL 97, 191801 (2006). • – High statistics constraints on alternative disappearance models. • (e.g. neutrino decay, neutrino decoherence, sterile neutrinos … ). • Search for sub-dominant ne appearance. • – First observation or improved limit for small mixing angle θ13. • Atmospheric neutrino oscillations. • – Contained vertex nm CC interactions.PRD 73, 072002 (2006). • – Neutrino-induced upward-going muons.PRD 75, 092003 (2007). • Cosmic ray physics. • – Muon charge ratio at TeV energies.arXiv/0705.3815 [hep-ex]. This Talk: • New preliminary results on nm disappearance based on exposure of • 2.5 x 10²⁰ protons on the NuMI target. arXiv/0708.1495 [hep-ex]. • New preliminary atmospheric muon and electron neutrino results. Andy Blake, Cambridge University The MINOS Experiment, slide 2
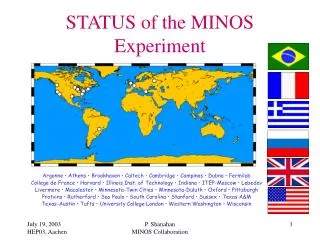
THE MINOS COLLABORATION Argonne • Athens • Benedictine • Brookhaven • Caltech • Cambridge • Campinas • College de France Fermilab •Harvard • IIT • Indiana • Minnesota Duluth • Minnesota Twin Cities • Oxford • Pittsburgh Rutherford •Sao Paulo • South Carolina • Stanford • Sussex • Texas A&M •Texas Austin Tufts •UCL • William & Mary • Wisconsin
The MINOS Experiment • Accelerator beam of muon neutrinos • produced by NuMI facility at Fermilab. • Near Detector at Fermilab to measure • spectrum and composition of beam. • Far Detector at Soudan mine to study • neutrino disappearance in beam. Soudan Mine, Minnesota 735 km Fermi Laboratory, Chicago
The NuMI Beam Neutrinos from the Main Injector (NuMI) • 120 GeV protons from Main Injector • directed onto 50g graphite target. • 10ms spills with 2.4s cycle time. • 2.5 x 10¹³ protons per pulse. • Typical beam power ~175 kW. • Relative target position is moveable, • making beam spectrum configurable. • Majority of running in LE configuration. Andy Blake, Cambridge University The MINOS Experiment, slide 5
The MINOS Detectors veto shield coil coil Far Detector Near Detector Functionally Identical Detectors 1 kT mass 1 km from target 282 steel planes 153 scintillator planes 100m underground 5.4 kT mass 735 km from target 486 steel planes 484 scintillator planes 700m underground steel and scintillator sampling calorimeters. Magnetized steel (B ~1.3T). GPS time-stamping for synchronization. Andy Blake, Cambridge University The MINOS Experiment, slide 6
nm Disappearance Measurement Look for nm deficit : nm spectrum spectrum ratio Un-oscillated (extrapolated from near detector) Oscillated (measured in far detector) Simulation Simulation Andy Blake, Cambridge University The MINOS Experiment, slide 7
2+ Years of NuMI Running 3.6x10²⁰ POTs accumulated ACCELERATOR SHUTDOWN RUN I (1.27x10²⁰ PoTs) Higher Energy Runs RUN IIa (1.23x10²⁰ PoTs) RUN IIb Updated results based on RUN I and RUN IIa (2.5x10²⁰ POTs). Andy Blake, Cambridge University The MINOS Experiment, slide 8
New and Improved Analysis • Improvements over 2006 analysis: • – Better reconstruction. • – Improved event selection. • – Improved shower modelling. • – New intra-nuclear modelling. • CC/NC interactions separated using • multivariate 2D likelihood procedure • combining information from: • – Track observables. • – Event length. • – Event kinematics. • Data and Monte Carlo agree well. Reject NC Select CC MINOS Preliminary Improvement in selection ~1% more CC signal. ~50% less NC background. Andy Blake, Cambridge University The MINOS Experiment, slide 9
Hadron Production Tuning • Parameterize Fluka 2005 hadron production model as f(xF,pT). • Fit to near detector data collected in different beam configurations. • – incorporate into the fit: horn focusing current, beam misalignments, • cross-sections, neutrino energy scale, neutral current background. • Improved agreement between data and MC in all configurations. anti-neutrinos LE-10 LE-10 pME pHE Reconstructed En (GeV) Andy Blake, Cambridge University The MINOS Experiment, slide 10
Predicting the Far Spectrum • Directly use near detector data to extrapolate from near to far detector. • – Use Monte Carlo to correct for energy smearing and detector acceptance. • – Use a beam transfer matrix derived from the beam simulation to relate • neutrino interactions in each detector via their parent hadrons. Far Near = transfer matrix Andy Blake, Cambridge University The MINOS Experiment, slide 11
Uncertainty Δm2 (10-3 eV2) sin2 2q Near/far normalization (4%) 0.065 <0.005 Abs. shower energy scale (10%) 0.075 <0.005 NC normalization (50%) 0.010 0.008 All other systematics 0.040 <0.005 Total uncertainty (quad. sum) 0.11 0.008 Statistical uncertainty 0.17 0.080 Systematic Uncertainties • Systematic uncertainties on oscillation parameters evaluated by fitting • fake data sets generated from MC with systematic shifts applied. • The three largest uncertainties identified from this study are included • as nuisance parameters in the oscillation analysis. Andy Blake, Cambridge University The MINOS Experiment, slide 12
Data sample Observed Expected (no osc.) Observed / Expected nm (all E) 563 738 ± 30 0.74 (4.4s) nm (<10 GeV) 310 496 ± 20 0.62 (6.2s) nm (<5 GeV) 198 350 ± 14 0.57 (6.5s) Oscillation Analysis PRELIMINARY OSCILLATION RESULTS FOR 2.5x10²⁰ POTs DATA. Andy Blake, Cambridge University The MINOS Experiment, slide 13
Allowed Parameter Space Best fit values: Andy Blake, Cambridge University The MINOS Experiment, slide 14
cosmic muons PCUP FC PCDN Atmospheric Neutrinos at MINOS • MINOS far detector can be used • to study atmospheric neutrinos. • – 5.4 kT mass generates high rate of • atmospheric neutrino interactions. • – 700m depth provides shielding • against cosmic muon background. • – magnetic field enables separation of • neutrino and anti-neutrino events. • – Calorimeter detector design enables • measurement of total energy. • Atmospheric neutrino analyses: • – contained vertex interactions. • PRD 73, 072002 (2006). • – neutrino-induced up-going muons. • PRD 75, 092003 (2007). • – Reported here are new preliminary • contained vertex muon and electron • atmospheric neutrino results. Contained vertex events classified as follows: • Fully Contained (FC). • Down-Going Partially Contained (PCDN). • Up-Going Partially Contained (PCUP). Andy Blake, Cambridge University The MINOS Experiment, slide 15
Atmospheric Muon Neutrinos • Updated contained vertex nm analysis • based on exposure of 12.23 kT-Yrs. • Observe 277 events, with expectation • of 354 ± 47 in absence of oscillations. • Select events with well-measured muon • direction based on timing information. • – 105 downward-going, 77 upward-going. • Select events with well-measured muon • charge based on curvature in B-field. • – 112 neutrinos, 55 anti-neutrinos. • Oscillation analysis carried out by • binning events according to their • Bayesian L/E resolution. Andy Blake, Cambridge University The MINOS Experiment, slide 16
Atmospheric Electron Neutrinos • Preliminary MINOS atmospheric ne results • based on exposure of 6.18 kT-Yrs. • – Identify ne events as contained vertex • electromagnetic showers. • – Observe 89 candidate ne events with • expectation of 89 ± 17 events. • – Observe 113 candidate nm events with • expectation of 150 ± 30 events. • Use selected ne event sample to measure • atmospheric neutrino flux normalization • relative to Bartol04 flux model. • – account for oscillations of true nm events • in selected ne event sample. Andy Blake, Cambridge University The MINOS Experiment, slide 17
Summary • MINOS has had a successful second year of beam running. • – 3.6x10²⁰ PoTs have now been accumulated after two years. • Updated oscillation measurement based on 2.5x10²⁰ PoTs. • Other oscillation analyses using beam data are progressing. • – ne appearance, anti-nm disappearance, sterile neutrinos… • Updated atmospheric muon and electron neutrino results. • – developing combined analysis of all MINOS atmospheric neutrino data. See poster session for more information on latest MINOS results Andy Blake, Cambridge University The MINOS Experiment, slide 18
Booster p p NuMI Beam Line Main Injector p p Fermi Laboratory
read out scintillator plane U read out V read out read out
PMT dark box Scintillator Strips PMT Dark Box WLS Fibres Multi-anode PMT M16 PMT
MINOS Calibration • Light injection system: • – PMT gain and linearity. • Cosmic ray muons: • – relative strip calibration. • – intra-detector calibration. • Calibration Error: • – ND calibration: 3.1% • – FD calibration: 2.3% • – ND/FD calibration: 3.8% • Overall Energy Scale: • – Calibration detector at CERN • measured e/m/p/p response. Energy Resolution (E in GeV): – Hadrons: 56%/√E 2% – Electrons: 21%/√E 4%/E Andy Blake, Cambridge University The MINOS Experiment, slide 24
Event Topologies in MINOS NC Event νeCC Event νμ CC Event 2.3m 3.5m 1.8m short, with typical EM shower profile long μ track & hadronic activity at vertex short event, often diffuse Andy Blake, Cambridge University The MINOS Experiment, slide 27
Selecting nm CC Interactions • CC events selected using a likelihood based procedure with six input PDFs • that show discrimminating power between true CC and NC interactions: • – Number of track planes. – Goodness of muon track fit. • – Number of track only planes. – Reconstructed muon charge. • – Track pulse height per plane. – Reconstructed y (Eshw/En). • 2D PDFs are used to take account of correlations with event length. • The discrimminant variable (PID) is defined as follows: Andy Blake, Cambridge University The MINOS Experiment, slide 28
Selecting nm CC Interactions Good agreement between data and Monte Carlo observed for these variables. Andy Blake, Cambridge University The MINOS Experiment, slide 29
Near Detector Interactions • High event rate in near detector. • – Multiple interactions per spill. • Events separated based on • topology and timing. • – Timing resolution ~20 ns • – Spatial resolution ~4 cm • No significant bias in event rate. beam U vs Z V vs Z time profile U vs V Andy Blake, Cambridge University The MINOS Experiment, slide 30
Far Detector Interactions • Beam interactions identifiable with “spill trigger”. • – GPS spill time is sent via internet from near to far detector. • – Events within ±50ms of spill written out by far detector DAQ. Clearly identifiable m ! Andy Blake, Cambridge University The MINOS Experiment, slide 31
Far Detector Timing Andy Blake, Cambridge University The MINOS Experiment, slide 32
Far Detector Event Rates Andy Blake, Cambridge University The MINOS Experiment, slide 33
Far Detector Distributions Far detector data is well described by oscillation best fit Andy Blake, Cambridge University The MINOS Experiment, slide 34
Far Detector Distributions REJECT CC SELECT CC Andy Blake, Cambridge University The MINOS Experiment, slide 35
Far Detector Backgrounds Andy Blake, Cambridge University The MINOS Experiment, slide 36
Comparison with 2006 Result (PRL 97, 191801) Andy Blake, Cambridge University The MINOS Experiment, slide 37
Comparison with 2006 Result (PRL 97, 191801) Andy Blake, Cambridge University The MINOS Experiment, slide 38
Changes from 2006 Result (PRL 97, 191801) • Improvements: • reco & selection • shower modelling • Data sets: • Pre-shutdown • Post-shutdown Andy Blake, Cambridge University The MINOS Experiment, slide 39
Comparison of Runs I and IIa Run I, Run IIa Contour Overlap = 56% Andy Blake, Cambridge University The MINOS Experiment, slide 40
nm Disappearance Andy Blake, Cambridge University The MINOS Experiment, slide 41
NC Analysis • Neutral current interactions are unaffected by standard oscillations, • so can be used to constrain oscillations into sterile neutrinos. • Define sterile mixing parameter fs as the fraction of disappearing • muon neutrinos that oscillate into sterile neutrinos. • Far detector data for this analysis currently blinded – analysis in progress. Andy Blake, Cambridge University The MINOS Experiment, slide 42
ne Appearance • MINOS can constrain or measure • θ13 by searching for ne appearance. • Challenges are to separate signal • and understand background. • – NC events form dominant background. • – Much effort has gone into developing • techniques for distinguishing between • electromagnetic and hadronic showers. • – Data-driven techniques for background • determination also in development. • MINOS sensitivity will soon be • comparable with the current • world best limit (CHOOZ). To be superseded soon Andy Blake, Cambridge University The MINOS Experiment, slide 43