Download
1 / 34
340 likes | 531 Views
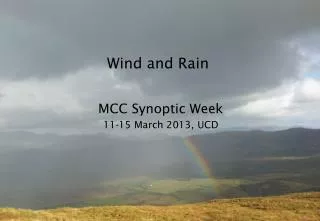
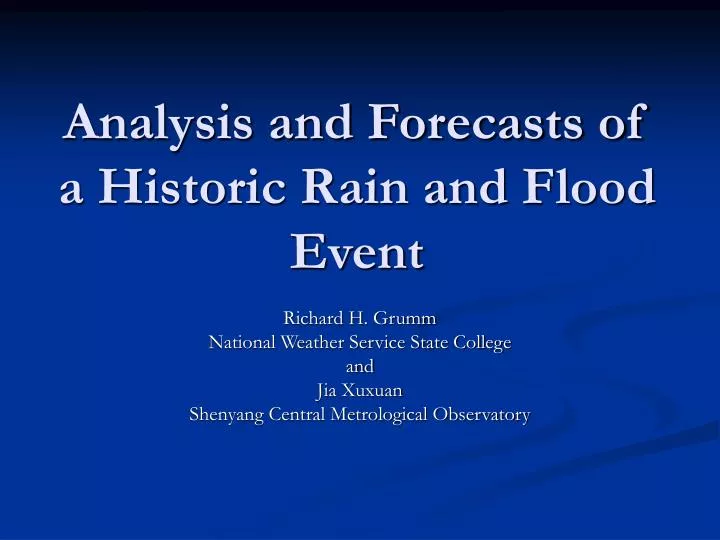
Analysis and Forecasts of a Historic Rain and Flood Event. Richard H. Grumm National Weather Service State College and Jia Xuxuan Shenyang Central Metrological Observatory. Overview. We will examine a major Flood event Significant impact on North Korea Devastated crops in mid-August

E N D
Analysis and Forecasts of a Historic Rain and Flood Event Richard H. Grumm National Weather Service State College and Jia Xuxuan Shenyang Central Metrological Observatory
Overview • We will examine a major Flood event • Significant impact on North Korea • Devastated crops in mid-August • Ideal to see what happened • Examine aspects of a major flood where did it rain • Analysis and forecast issues can be addressed • What did the pattern look like and was it forecast as such? • Ideal application of ensembles • Precipitation amounts (Probabilities) and timing • Meteorological setting • Intensity of key features associated with heavy rainfall. • Key features associated with heavy rains events • Put features in a context Climate anomalies of key features
A few points • Some key characteristics • Anomalously high PW values in affected region • Strong and anomalous low-level southerly winds • Tropical Moisture streams • A pattern often seen in the eastern United States • Blend EPS and Climatic Data can • Define areas of high confidence poorman’s RMOP • In this case the GEFS was remarkable in the amounts of rain forecast • What would an good mesoscale ensemble have done?
Rainfall Summary • Period ending 0000 UTC 14 August was a big event • So was the period ending 0000 UTC on 12 August • JRA and CMORPH data • showed the same affected areas • Similar amounts over similar time periods. • 350 mm is ~14 inches biggest report was 17in. • We lack definitive rainfall data!
The Pattern • Classic quasi-stationary North-South frontal system • Maddox Synoptic Type • Similar to US of same pattern (next Slide) • Generalized Pattern • N-S front • Above normal PW in warm sector with tropical connection • Strong southerly flow into region of heavy rainfall.
Synoptic Type schematic SURFACE 850 MB L COOL AND DRY COOL AND MOIST SLOW MOVING OR STATIONARY FRONT OLD WARM FRONT max AXIS Td=10oC Td=66oF Td$70oF Td=12oC Td=14oC Td=60oF 130 nm 130 nm A POTENT LOW-LEVEL JET IS PRESENT
EPS data to Forecast these events • Data: NCEP GEFS data • Focus on key features • Anomalies of key predictants • Probabilities of QPF over discrete time intervals and values • SREF and GEFS have history of success with this event type! • Salient points: • Uncertainty and probabilities are the strengths of ensemble system, • The future of forecasting is linked to the strengths of the EPS, • Ensembles add the most value in cases of high uncertainty, • Never try to chose a member in a high uncertainty event, • In quiescent weather or areas of high confidence, the ensemble has minimal value*. • Heavy rain we need probabilities of key threshold values! *Derived from Jun Du-NOAA/NCEP 08 November 2007
EPS Forecasts • Plumes showed period of heavy rains • Patterns were well forecast too • Probabilities with patterns gave some measure of confidence
0000 UTC 9 August • GEFS showed a strong signal • We can see the overall pattern of heavy rainfall • PW and v-wind anomalies • There was some uncertainty • Timing and amounts of QPF • location and intensity of key features • Useful data in the probabilities of QPF values • Big rain look at 25 mm, 50mm, and 100mm • We need a good feel for model/EPS climo what is an historic event in the model atmosphere?
0000 UTC 10 August • GEFS showed a strong signal • We can see the overall pattern of heavy rainfall • PW and v-wind anomalies • There was some uncertainty • Timing and amounts of QPF • location and intensity of key features • Useful data in the probabilities of QPF values • Big rain look at 25 mm, 50mm, and 100mm • We need a good feel for model/EPS climo what is an historic event in the model atmosphere?
Review • We examined a major Flood event over North Korea • Devastated crops in mid-August • Did it have other implications? • This historic case was used to • Examine aspects of a major flood events and • Issues related to both the analysis and forecast of such significant events • We do not really know the ground truth and each analysis gives us a different answere • The forecasts were quite good • It was an Ideal application of ensembles • Precipitation amounts (Probabilities) and timing • Meteorological setting Features associated with significant flood events. • The event seemed to put the features in a context Climate anomalies of key features associated with heavy rainfall.
Acknowledgements • NCEP for the data GEFS and GEFS bias corrected • CPC for the CMOPRH data • Robert Hart and Jeremy Ross of climatic anomalies and anomalies data base.
Wet Reference • Doswell, C.A. III, H. E. Brooks and R.A. Maddox, 1996: Flash Flood forecasting: An ingredients-based methodology. Wea. Forecasting, 11, 560-581. • Harneck, R. P., Apffel, K., and Cermak, J. R., 1999. Heavy precipitation events in New Jersey: Attendant upper air conditions. Wea. Forecasting, 14: 933-954. • Heideman, K. F., and Fritsch, J. M., 1988. Forcing mechanisms and other characteristics of significant summertime precipitation. Wea.Forecasting, 3: 115-30. • Konrad, C. E., 1997. Synoptic-scale features associated with warm season heavy rainfall over the interior southeastern United States. Wea. Forecasting, 12: 557-571. • Konrad, C. E., 2001. The heaviest precipitation events over the eastern United States: Considerations of scale. Journal of Hydrometeorology 2: 309-325. • Konrad, C. E., Perry, B. and Smith, A. B., 2005. Regional Variations in the Synoptic patterns • Associated with Warm Season Heavy Rainfall Across the Eastern United States. Intl. J. Climatol. • Received for review. • Maddox, R. A., C. F. Chappell, and Hoxit, L. R., 1979. Synoptic and meso-scale aspects of flash flood • events. Bull. Amer. Meteor. Soc., 60: 115-123. • Smith, A, B., 2005. The Location of Heaviest Rainfall Relative to Frontal Boundaries during the Warm • Season. Master’s Thesis, University of North Carolina at Chapel Hill. • Winkler, J. A., 1988. Climatological characteristics of summer-time extreme rainstorms in Minnesota. • Ann. Assoc. Am. Geogr., 78: 57-73.