Download
1 / 23
230 likes | 387 Views
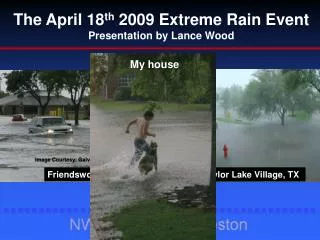
Analysis of Radar-Rain Rate Relations During the Southeast Texas Flood Event of 18 April 2009. Steve Vasiloff, NOAA/National Severe Storms Laboratory Jeffrey Lindner, Harris County Flood Control District Lance Wood, NOAA/National Weather Service, Houston. Outline.

E N D
Analysis of Radar-Rain Rate Relations During the Southeast Texas Flood Event of 18 April 2009 Steve Vasiloff, NOAA/National Severe Storms Laboratory Jeffrey Lindner, Harris County Flood Control District Lance Wood, NOAA/National Weather Service, Houston 2010 National Flood Workshop, Houston, TX
Outline • Radar reflectivity rainrate (Z-R) relations • Radar resolution impacts • Heavy rain and wind impacts on gauges • 5 and 1-min radar and gauge comparisons • Examples of radar and gauge uncertainties • Concluding remarks
NSSL Q2 systemhttp://nmq.ou.edu • Next-generation quantitative precipitation estimation (QPE) system • 1 km resolution CONUS every 5 min • Multisensor products • Dynamic Z-R • Q2 radar-based used as base field for West Gulf RFC operations (with local gauge correction) • Other RFCs “cut and paste” Q2 into their systems
Q2 1-km res 180 * * 130
5-min Q2 dBZ; gauge dataconvective & tropical Z-Rs Q2 5-min reflectivity Gauge Tropical QPE Convective QPE 5 min data are aggregated from 1st to 5th min past top of the hour
5-min Q2 dBZ & gauge dataconvective & tropical Z-Rs Q2 5-min reflectivity Hi-res reflectivity Gauge
1-min hi-res KHGX & gauge Hi-res reflectivity Gauge
5-min Q2 dBZ; gauge dataconvective & tropical Z-Rs Q2 5-min reflectivity Gauge Tropical QPE Convective QPE 5 min data are aggregated from 1st to 5th min past top of the hour
1-min hi-res KHGX & gauge Hi-res reflectivity Gauge
Radar clutter filtering Radar echo minima due to filter?
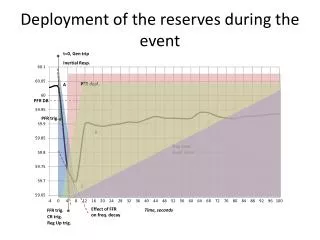
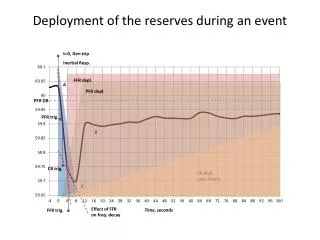
5 min sampling – constant rainrate for QPE Echo motion
Summary • Urban FF warnings require hi-res data • 1 –min data too noisy? • High rainrates and winds reduce confidence in gauge data – difficult to quantify undercatch • 15-30%???? • Clutter filter causes uncertainty in radar data • Need better gauge-radar metadata • Know which gauges are in clutter, zero isodop • Gauge QC is an ongoing issue
Q2 future • Higher resolution • 2.5 min radar (NEXGEN) • 10-15 min gauge • MADIS/additional gauge networks (HCFCD) • Gauge quality control algorithm • Using temporal analysis of radar-gauge bias • Spatial checks • Gauge Quality Index