Download
1 / 9
90 likes | 180 Views
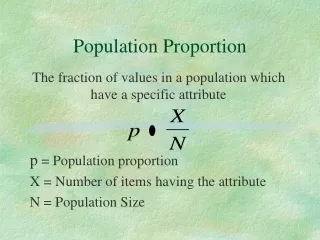
Inference for a Population Proportion. Section 12.1. Inference for Proportions. To estimate a single population proportion. To Compare two population proportions. To Compare more than two population proportions (Chapter 13). Remember p = population proportion (success).

E N D
Inference for a Population Proportion Section 12.1
Inference for Proportions • To estimate a single population proportion. • To Compare two population proportions. • To Compare more than two population proportions (Chapter 13). • Remember p = population proportion (success). • Estimate p using p-hat (sample proportion).
Sampling Distribution of p-hat • Mean of p-hats = p, so p-hat is an unbiased estimator of p. • Standard Deviation of p-hats = √pq/n • Approximately normal for large samples. • To standardize p-hat into a z value: z = (p-hat – p) / √pq/n • Use p0 for p in tests. • Use p-hat for p in confidence intervals (SE). • Confidence Interval: p-hat ± z*SE
Assumptions: • Data are an SRS. • N ≥ 10n. • np0 ≥ 10 or np-hat ≥ 10 • nq0 ≥ 10 or nq-hat ≥ 10 • Look at page 663 to see what practical issues arise.
Z-Procedures • Confidence Interval: p-hat ± z* √(p-hat)(q-hat)/n • Hypothesis Test: z = (p-hat – p0) / √p0q0/n • H0: p = p0 • Ha: p > p0 • Ha: p < p0 • Ha: p ≠ p0
Example: Heterosexuals • In a sample of 2673 adult heterosexuals 170 had multiple partners. P-hat = .0636. Find a 99% confidence interval for the proportion of all adult heterosexuals who have multiple partners. • (.0514, .0758) • Interpret results. • Calculator.
Example: Count Buffon • Count Buffon tossed a coin 4040 times and got 2048 heads. P-hat = .5069. Was Buffon’s coin unbalanced? • Hypotheses • Assumptions • Test: z statistic and p-value • z = .88, p-value = .3788 • Summarize results. • Do a 95% confidence interval. • (.4915, .5223)
Choosing a Sample Size • If we want a certain margin of error at a certain confidence level: Margin of Error = z*se. We don’t know p-hat since we have not done a sample yet so either use .5 for p-hat or do a test sample and use its p-hat.
Example: Voting • What % of voters will vote for a certain candidate? Need an SRS and want a 95% CI and margin of error ≤ 3%. What sample size is needed? • n ≥ 1067.1, so 1068.