Download
1 / 14
150 likes | 322 Views
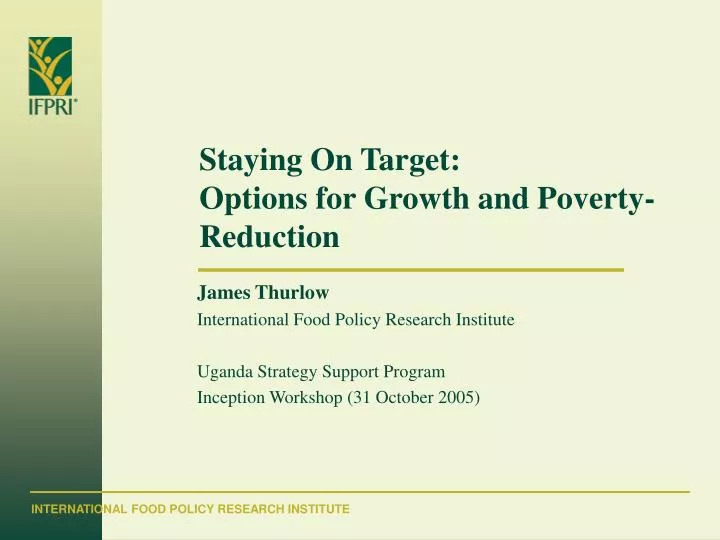
Staying On Target: Options for Growth and Poverty-Reduction. James Thurlow International Food Policy Research Institute Uganda Strategy Support Program Inception Workshop (31 October 2005). Overview. Review past growth and poverty reduction Growth/poverty linkages and the economic model

E N D
Staying On Target: Options for Growth and Poverty-Reduction James Thurlow International Food Policy Research Institute Uganda Strategy Support Program Inception Workshop (31 October 2005)
Overview • Review past growth and poverty reduction • Growth/poverty linkages and the economic model • Is Uganda’s current growth path sufficient to meet the PEAP targets? • How could pro-poor growth be accelerated? • Conclusions and next steps Page 2
1. Past Growth and PovertyWhat has happened to incomes and poverty? Page 3
1. Past Growth and PovertyIs the growth/poverty relationship broken? How can there be both growth and rising poverty? ∆poverty = ∆growth . ∆distribution • The PEAP suggests reasons for the shift in the structure or distribution of growth during 1999-03, including… Slower agricultural growth Falling agricultural prices (cash crops and food) Population growth (fertility) • How can we assess the growth/poverty relationship? Page 4
Employment, land and other assets Factor inputs Factor returns Economic growth Household incomes and poverty Agriculture Industry Rural Linkages Domestic markets for goods and services Production Consumption Linkages (prices) (prices) Indirect taxes Exports and imports Urban Services Foreign markets and countries Foreign aid/loans Recurrent spending Direct taxes Government Sector policies Household policies Public investment and macroeconomic policies Productivity (technology) FDI Savings Investment (capital) Private investment
2. Capturing Growth/Poverty Linkages in the ModelData and model design Data sources • Reconcile a wide range of information National accounts, trade data, household surveys, etc • Current model uses the 1999 household survey and SAM Model design • Captures growth… Dynamic model with detailed sectors (technologies) • Captures poverty… Detailed factor (i.e., labor) markets Detailed household groups linked directly to the household survey (rural/urban, agro-eco. zone, …) Page 6
3. Poverty reduction under the current growth pathThe level and structure of growth ‘Current growth path’ Page 7
3. Poverty reduction under the current growth pathPoverty outcomes, 1999-2015 Page 8
4. Accelerating Pro-Poor GrowthAgriculture and non-agriculture Page 9
4. Accelerating Pro-Poor GrowthImpact on national poverty headcount Current growth path 5% growth growth effect Accelerated growth paths 7% growth distribution effect Page 10
4. Accelerating Pro-Poor Growth Food crops and cash crops Page 11
4. Accelerating Pro-Poor GrowthImpact on national poverty headcount Current growth path 5% growth Accelerated growth paths 7% growth Page 12
5. Conclusions • Growth is a requirement for significant poverty reduction Uganda is still on track to meet the PEAP target of 28% poverty by 2014 • However, the structure or distribution of growth can be equally important (i.e., the growth/poverty elasticity) • Currently agricultural growth is more pro-poor than non-agricultural growth • Broad-based growth is needed for transformation • Both food and cash crops are equally pro-poor • However, cash crops require very high growth rates Page 13
5. Next Steps • We can use this modeling approach to analyze… Policy impacts on growth and poverty Trade-offs between policies and objectives Impacts of financing public investments Regional inequality and lagging regions Rural-urban and farm/non-farm linkages • The results show that agricultural growth is pro-poor… • But how to get agriculture to grow? • Operationlizing agricultural growth is the subject of the next presentations… Page 14