Download
1 / 1
10 likes | 131 Views
Quantifying Uncertainty in Ecosystem Studies (QUEST) John L. Campbell 1 , Ruth D. Yanai 2 , Mark B. Green 1,3 , Carrie Rose Levine 2 , Mary Beth Adams 1 , Douglas A. Burns 4 , Donald C. Buso 5 ,

E N D
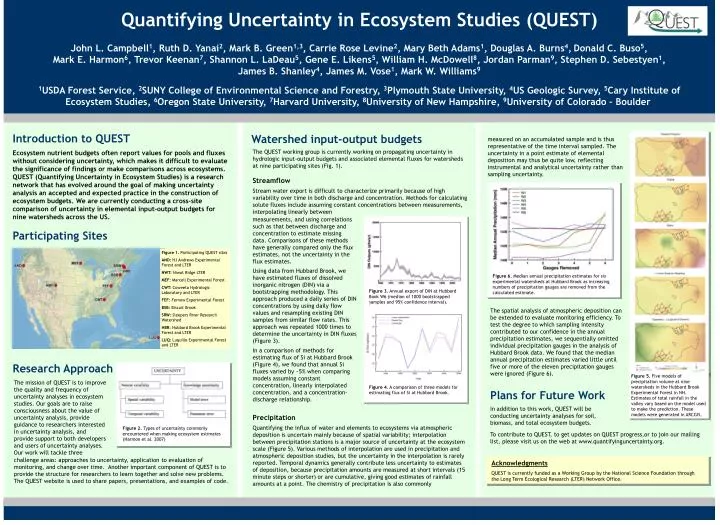
Quantifying Uncertainty in Ecosystem Studies (QUEST) John L. Campbell1, Ruth D. Yanai2, Mark B. Green1,3, Carrie Rose Levine2, Mary Beth Adams1, Douglas A. Burns4,Donald C. Buso5, Mark E. Harmon6, Trevor Keenan7, Shannon L. LaDeau5, Gene E. Likens5, William H. McDowell8, Jordan Parman9, Stephen D. Sebestyen1, James B. Shanley4, James M. Vose1, Mark W. Williams9 1USDA Forest Service, 2SUNY College of Environmental Science and Forestry, 3Plymouth State University, 4US Geologic Survey, 5Cary Institute of Ecosystem Studies, 6Oregon State University, 7Harvard University, 8University of New Hampshire, 9University of Colorado – Boulder Watershed input-output budgets Introduction to QUEST Ecosystem nutrient budgets often report values for pools and fluxes without considering uncertainty, which makes it difficult to evaluate the significance of findings or make comparisons across ecosystems. QUEST (Quantifying Uncertainty in Ecosystem Studies) is a research network that has evolved around the goal of making uncertainty analysis an accepted and expected practice in the construction of ecosystem budgets. We are currently conducting a cross-site comparison of uncertainty in elemental input-output budgets for nine watersheds across the US. measured on an accumulated sample and is thus representative of the time interval sampled. The uncertainty in a point estimate of elemental deposition may thus be quite low, reflecting instrumental and analytical uncertainty rather than sampling uncertainty. The QUEST working group is currently working on propagating uncertainty in hydrologic input-output budgets and associated elemental fluxes for watersheds at nine participating sites (Fig. 1). Streamflow Stream water export is difficult to characterize primarily because of high variability over time in both discharge and concentration. Methods for calculating solute fluxes include assuming constant concentrations between measurements, interpolating linearly between Figure 1. Participating QUEST sites AND: HJ Andrews Experimental Forest and LTER NWT: Niwot Ridge LTER MEF: Marcell Experimental Forest CWT: Coweeta Hydrologic Laboratory and LTER FEF: Fernow Experimental Forest BSB: Biscuit Brook SRW: Sleepers River Research Watershed HBR: Hubbard Brook Experimental Forest and LTER LUQ: Luquillo Experimental Forest and LTER measurements, and using correlations such as that between discharge and concentration to estimate missing data. Comparisons of these methods have generally compared only the flux estimates, not the uncertainty in the flux estimates. Using data from Hubbard Brook, we have estimated fluxes of dissolved inorganic nitrogen (DIN) via a bootstrapping methodology. This approach produced a daily series of DIN concentrations by using daily flow values and resampling existing DIN samples from similar flow rates. This approach was repeated 1000 times to determine the uncertainty in DIN fluxes (Figure 3). In a comparison of methods for estimating flux of Si at Hubbard Brook (Figure 4), we found that annual Si fluxes varied by ~5% when comparing models assuming constant concentration, linearly interpolated concentration, and a concentration-discharge relationship. Participating Sites Figure 6. Median annual precipitation estimates for six experimental watersheds at Hubbard Brook as increasing numbers of precipitation gauges are removed from the calculated estimate. Figure 3. Annual export of DIN at Hubbard Book W6 (median of 1000 bootstrapped samples and 95% confidence interval). The spatial analysis of atmospheric deposition can be extended to evaluate monitoring efficiency. To test the degree to which sampling intensity contributed to our confidence in the annual precipitation estimates, we sequentially omitted individual precipitation gauges in the analysis of Hubbard Brook data. We found that the median annual precipitation estimates varied little until five or more of the eleven precipitation gauges were ignored (Figure 6). Research Approach Figure 5.Five models of precipitation volume at nine watersheds in the Hubbard Brook Experimental Forest in NH. Estimates of total rainfall in the valley vary based on the model used to make the prediction. These models were generated in ARCGIS. The mission of QUEST is to improve the quality and frequency of uncertainty analyses in ecosystem studies. Our goals are to raise consciousness about the value of uncertainty analysis, provide guidance to researchers interested in uncertainty analysis, and provide support to both developers and users of uncertainty analyses. Our work will tackle three Plans for Future Work In addition to this work, QUEST will be conducting uncertainty analyses for soil, biomass, and total ecosystem budgets. Figure 4. A comparison of three models for estimating flux of Si at Hubbard Brook. Precipitation Quantifying the influx of water and elements to ecosystems via atmospheric deposition is uncertain mainly because of spatial variability; interpolation between precipitation stations is a major source of uncertainty at the ecosystem scale (Figure 5). Various methods of interpolation are used in precipitation and atmospheric deposition studies, but the uncertainty in the interpolation is rarely reported. Temporal dynamics generally contribute less uncertainty to estimates of deposition, because precipitation amounts are measured at short intervals (15 minute steps or shorter) or are cumulative, giving good estimates of rainfall amounts at a point. The chemistry of precipitation is also commonly Figure 2. Types of uncertainty commonly encountered when making ecosystem estimates (Harmon et al. 2007) To contribute to QUEST, to get updates on QUEST progress,or to join our mailing list, please visit us on the web at www.quantifyinguncertainty.org. challenge areas: approaches to uncertainty, application to evaluation of monitoring, and change over time. Another important component of QUEST is to provide the structure for researchers to learn together and solve new problems. The QUEST website is used to share papers, presentations, and examples of code. Acknowledgments QUEST is currently funded as a Working Group by the National Science Foundation through the Long Term Ecological Research (LTER) Network Office. Acknowledgments We thank Ian Halm for field assistance, Amey Bailey for providing meteorological data, and Jane Hislop, Sarah Kelly, Anna Keim, Jennifer Plouffe, Lisa Martel and Sabrina La Fave for sample preparation and laboratory analyses. Funding for this research was provided by the USDA Forest Service, Northeastern Research Station, Newtown Square, PA. The National Science Foundation and the New York State Energy Research Development Authority also provide support for this work.