Download
1 / 5
50 likes | 189 Views
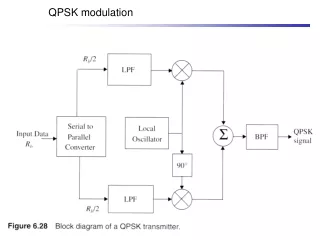
Cycle Slip Evaluation of Dual Polarized 12 Gsps QPSK Optical Channel. 15 November 2010. Optical Chanel Cycle Slip Analytical Simulator – Presentation Mode. Dual pole QPSK channel at 12 Giga-symbols per second on each pole Models phase and thermal noise independently on each pole

E N D
Cycle Slip Evaluation of Dual Polarized 12 Gsps QPSK Optical Channel 15 November 2010
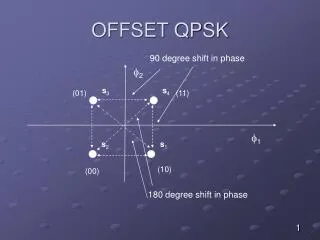
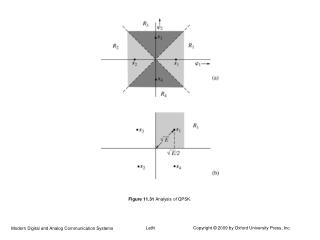
Optical Chanel Cycle Slip Analytical Simulator – Presentation Mode • Dual pole QPSK channel at 12 Giga-symbols per second on each pole • Models phase and thermal noise independently on each pole • Phase noise expressed as Full Band Half Maximum (FBHM) power line width (Hz) • Horizontal – 500.5 kHz • Vertical – 205 kHz • Simulator presentation mode • Visual response to varying noise • Separate controls for each noise type • QPSK waveform, corrected and uncorrected constellation displayed Corrected phase constellation Horizontal pole constellations Vertical pole constellations Uncorrected phase constellation Window Size
Optical Channel Cycle Slip Analytical Simulator – Analysis Mode Number of Test Cases From All Combinations of Input Variables • Evaluate variables across a range of values • Independent controls for each polarization • phase and thermal noise • BPE window size • Results output to Excel for data reduction • Discrete noise and window size input variables across specified range • Resulting range of output variables Line Width Range Per Pole BPE Window Size Range Signal to Noise Range Per Pole
Excel Output - Phase and Thermal Noise Effect on Cycle Slip as a Function of the Block Phase Estimator (BPE) Window Size • Cycle Slip Likelihood for the given example • Phase noise dominate signals: Improves as the BPE window size decreases • thermal noise dominate signals Improves as the BPE window size increases up to ~255 points Degrades thereafter • Indicates ~120 point BPE should be best performer in the presence of phase and thermal noise
Excel Output - Combined Phase and Thermal Noise Effect on Cycle Slip as a Function of the BPE Window Size • Cycle Slip Likelihood for the given example • Signal quality degradation due equally to phase and thermal noise: 500 KHz line width 5.3 dB signal to noise ratio • Best performance in the range of 100 – 130 point Block Phase Estimator